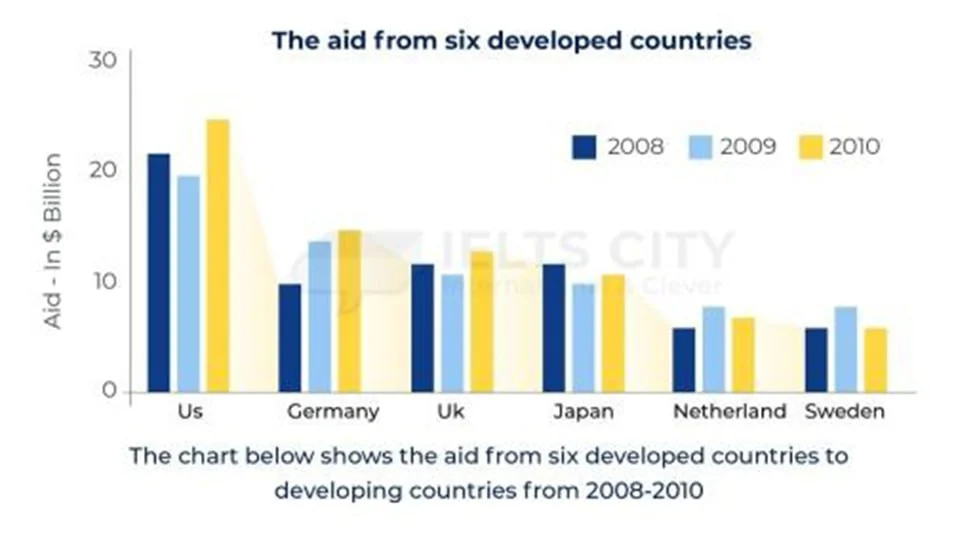
The chart below shows the aid from six developed countries to developing countries from 2008 to 2010.
این سوال ترکیب دو نوع اصلی از سوال تسک 1 هست:
گزارش شباهت ها و تفاوت ها
گزارش تغییرات در طول زمان
در این سوال، اولویت با گزارش شباهت و تفاوتهاست و بعد تغییرات در طول زمان - دقت کنید که توی گراف (یعنی محور ایکس و وای) هیچ اثری از زمان نیست.
در پایین به نمونه ای که نوشتم و دادم دوستانم بررسی کردن توجه کنید. دقیقا به همین شکل نوشته شده.
The bar chart shows the amount of money (in billion dollars) allocated as aid to developing countries by six developed nations, listed in descending order: the US, Germany, the UK, Japan, the Netherlands, and Sweden, between 2008 and 2010. The data suggest that the aid from these countries ranges from a very high amount to a very low, with the US on the high end of the spectrum and the Netherlands and Sweden on the opposite end.
The overall amount of aid from the US was approximately twice that offered by the mid-range countries: Germany, the UK, and Japan. The figure for this most generous country had risen to an unprecedented rate of nearly 25 billion by 2010, recovering from a decline to slightly below 20 million. Similarly, unlike Japan, funding increased in Germany and the UK from about 10 to slightly above that, with only the former showing consistency. In contrast, Japan’s aid declined by a few million, particularly in the second year, although the track record remained around 10.
Countries with aid around or below 5, the Netherlands and Sweden, behaved similarly, as both experienced a spike in funding in the second year, hovering slightly over 5 million. However, both countries showed lower amounts in the preceding and subsequent years.