
بلاگ
مقالات و اخبار
Task 1
comparison/correlation
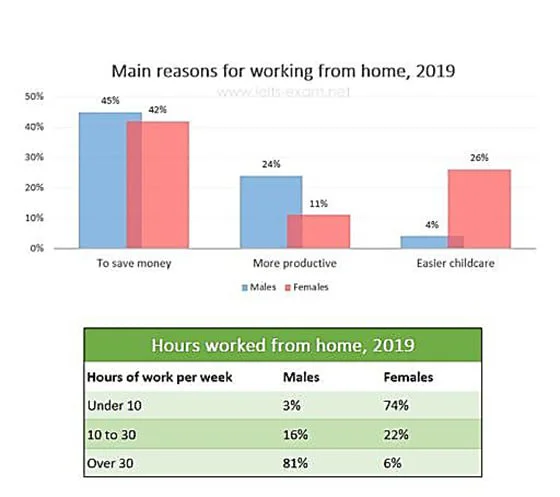
The chart and the table show the main reasons workers chose to work from home and the hours males and females worked from home in 2019.
The bar chart and table compare the main motivations for working from home among men and women in 2019 together with the weekly hours they worked remotely. The data suggest a clear gender contrast: me…
Task 1
comparison/correlation
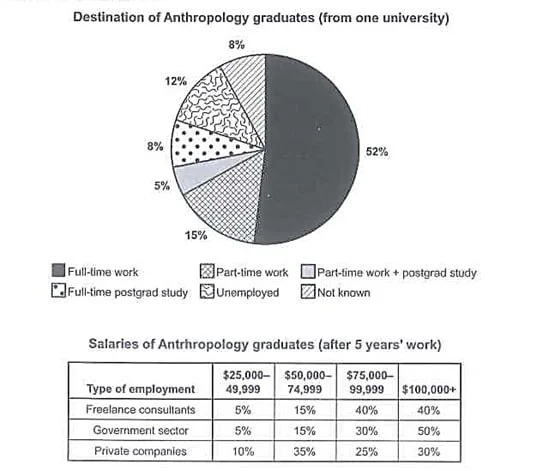
The chart shows what anthropology graduates from one university did after finishing their undergraduate degree course. The table shows the salaries of the anthropologists in work after five years.
The pie chart shows the six destinations of anthropology undergraduates, and the table shows their salary range in three types of employment after five years of employment. Overall, a markedly higher…
