
بلاگ
مقالات و اخبار
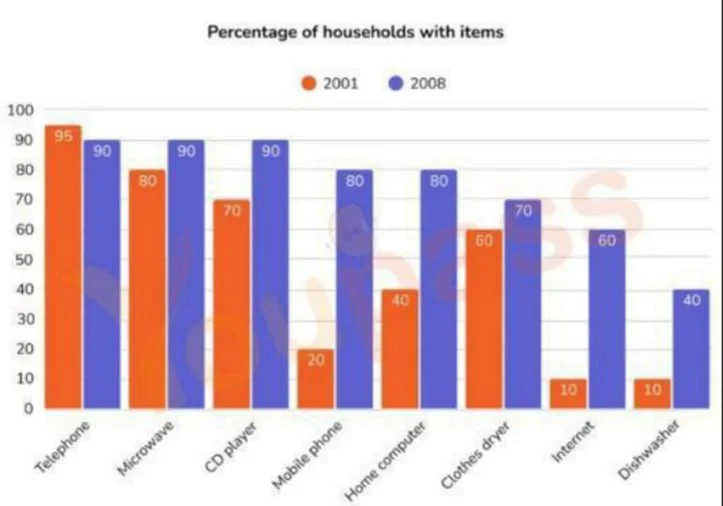
The graph shows the percentage of households in one country that had various goods between 2001 and 2008.
The bar chart shows the proportion of households that owned a range of home appliances and home technologies in a country in 2001 and 2008. Overall, ownership increased for every item except telephone…
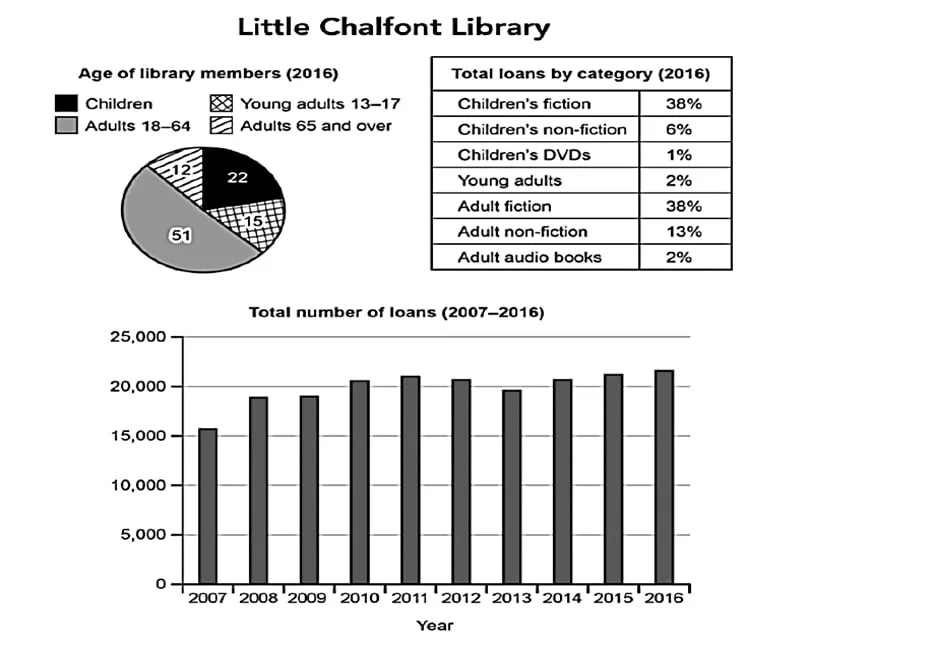
The charts below give information about a public library in a town called Little Chalfont.
The pie chart and the table show the proportional distribution of library members across four age groups and the breakdown of loans across seven categories in Little Chalfont. The bar chart shows the…
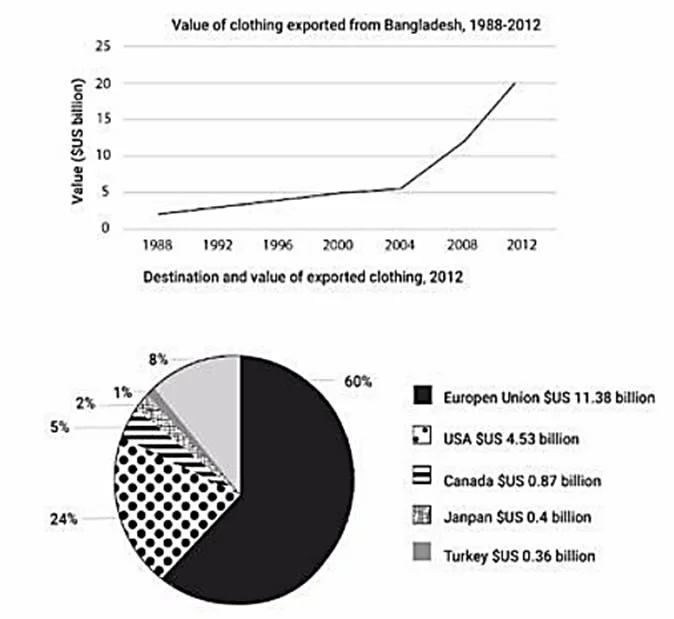
The graph shows the value of clothing exported from Bangladesh between 1998 and 2012, and the chart shows the destinations and value of exported clothing in 2012.
The line graph shows the value of Bangladesh s clothing exports from 1998 to 2012, while the pie chart compares the distribution of these exports across five markets in 2012. The figures indicate that…
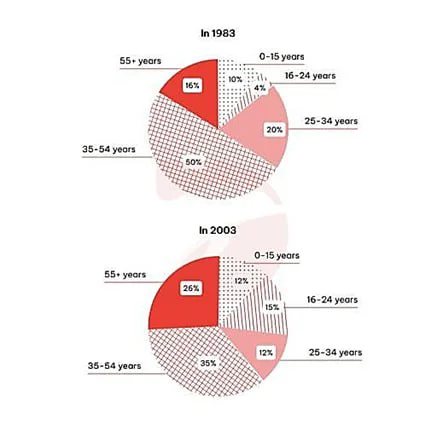
The charts give information about the age of visitors from the UK to Spain in 1983 and in 2003.
The pie charts show the proportional distribution of UK visitors to Spain across five age groups in 1983 and 2003. While neither chart indicates a linear correlation between age and travel rates, the…
