
بلاگ
مقالات و اخبار
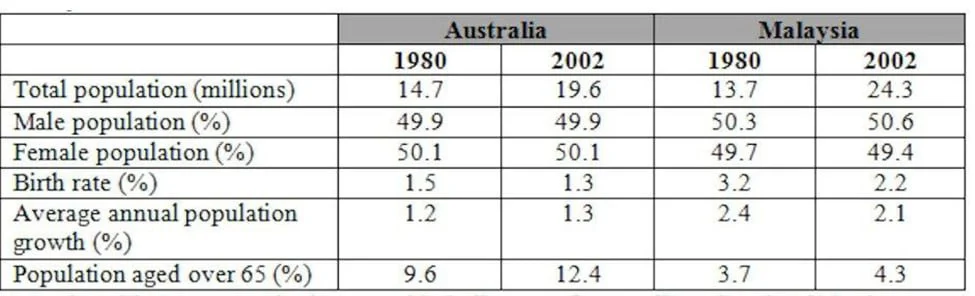
The table below gives information about the population of Australia and Malaysia in 1980 and 2002.
The table compares various demographic indicators for Australia and Malaysia in 1980 and 2002. The data show that Malaysia experienced faster population growth driven by higher fertility rates, while…
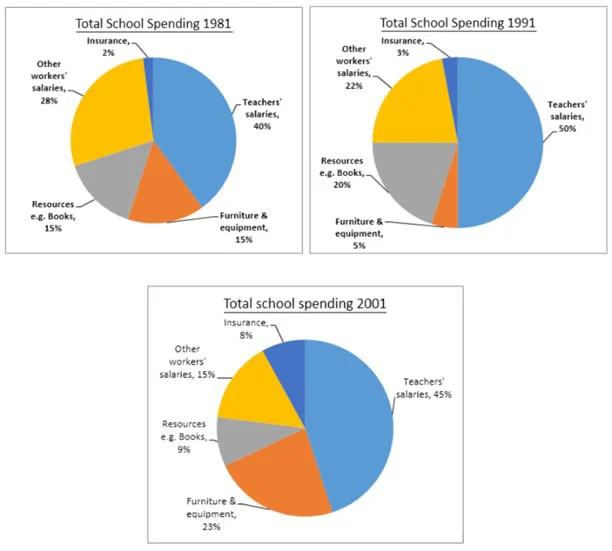
The three pie charts show the changes in the annual spending by a particular UK school in 1981, 1991, and 2001.
The pie charts show the proportional distribution of a school's total spending in the UK across five categories for the years 1981, 1991, and 2001. The data suggest that salaries for teachers and…
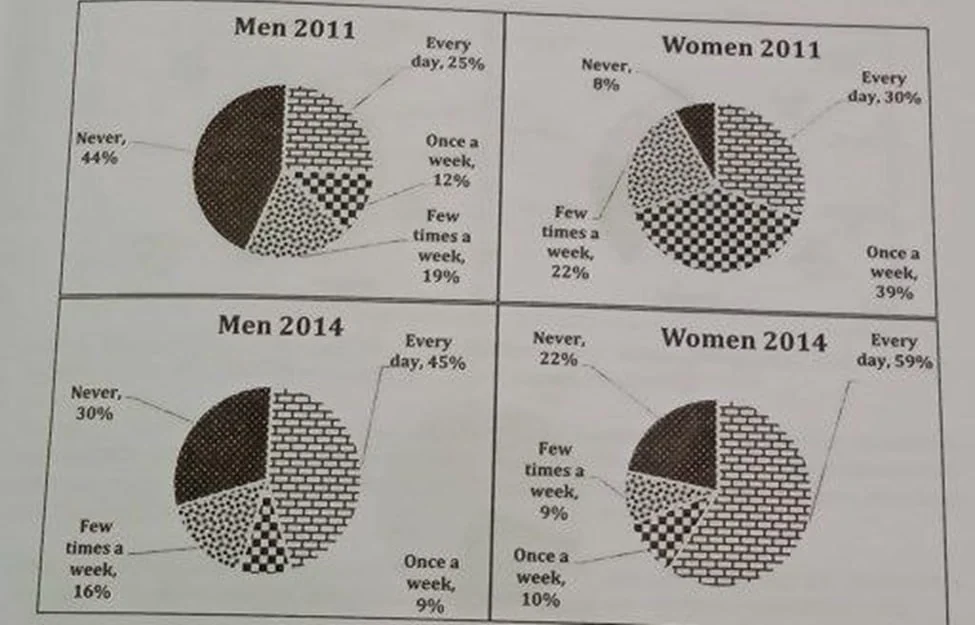
The charts show the use of social media by men and women in Australia in 2011 and 2014.
The pie charts compare how men and women in Australia used social media in 2011 and 2014. The data suggest a nationwide shift toward daily usage for both genders and a collapse in mid-frequency engage…
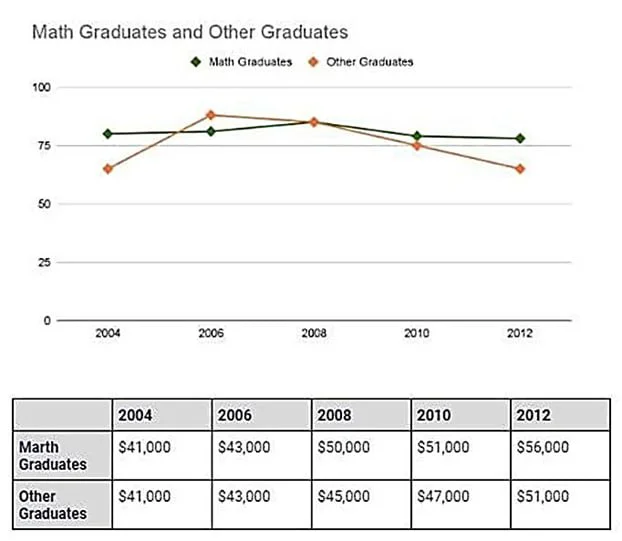
The graphs below show the percentage of graduates who found full-time jobs after graduation from a university in Australia and the average salary of these graduates, from 2004 to 2012.
The line graph and the table show the proportions of two groups of graduates (mathematics and others) from an Australian university who were employed full-time, along with their average salaries, betw…
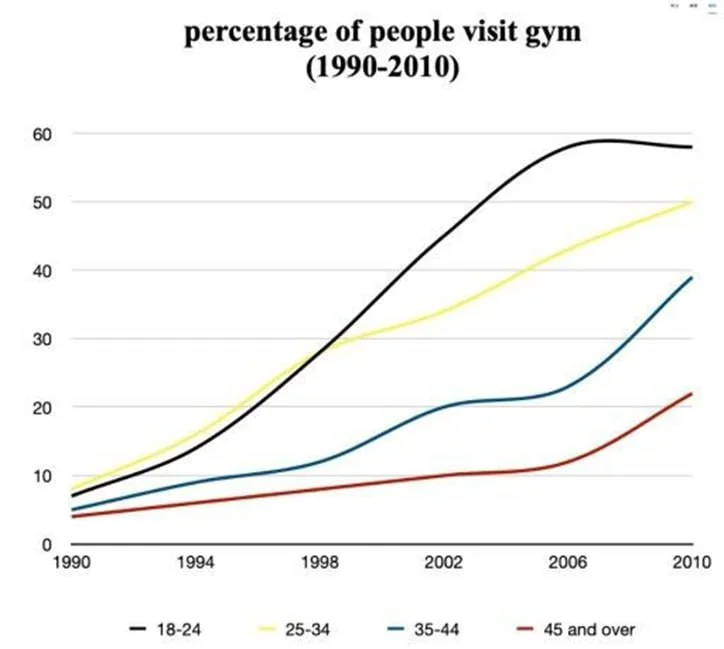
The graph below shows the percentage of people visiting the gym once a month or more between 1990 and 2010.
The line graph shows the proportion of people in four age groups, namely 18 24, 25 34, 35 44, and 45+, who did physical activity once or a few times a month from 1990 to two decades later. The data su…
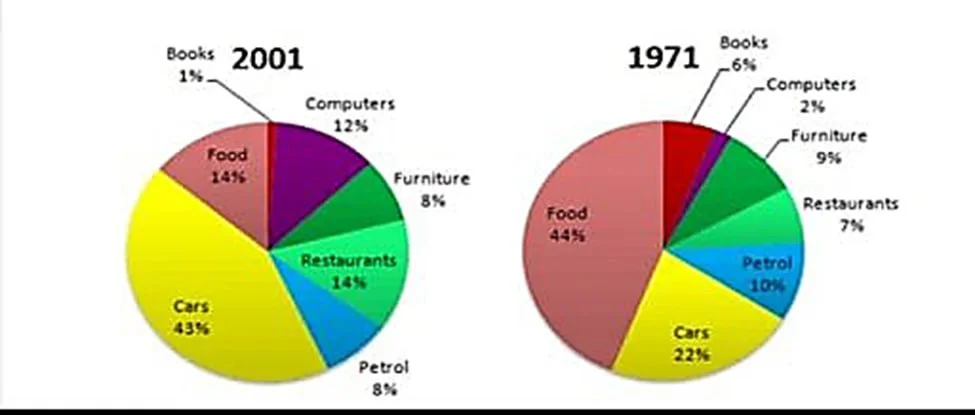
The graphs show changes in the spending habits of people in the UK between 1971 and 2001.
The pie charts show how people in the UK allocated their spending across seven categories in two years: 1971 and three decades later. The data suggest two distinct patterns: some areas namely food, bo…
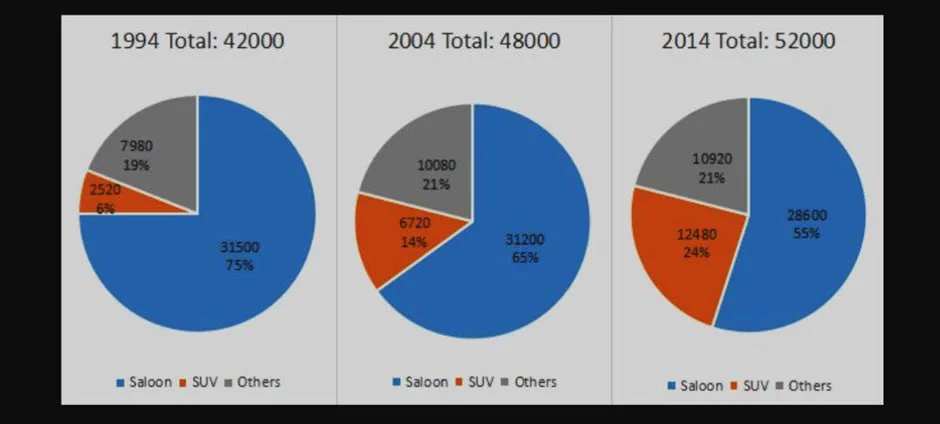
The charts show the number and percentage of the sales of new cars in Australia in April 1994, 2004, and 2014.
The pie charts show changes in the number and sales distribution of saloons, SUVs, and other unspecified car types in Australia in April over three years: 1994, 2004, and 2014. The data reflect an inc…
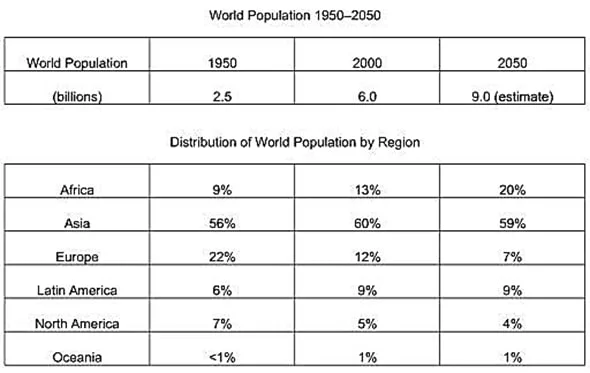
The tables below give information about the world population and distribution in 1950 and 2000, with an estimate of the situation in 2050.
The tables show the change in global population and its proportional distribution across six regions at two points in time: 1950 and 2000, as well as projections for 2050. The data suggests that the i…
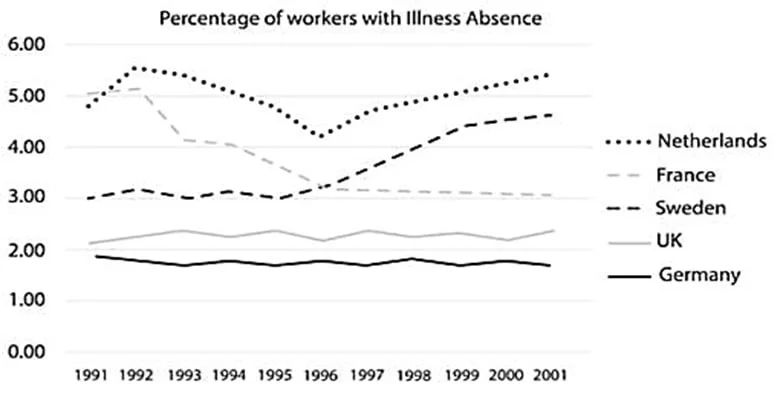
The graph below shows the percentage of workers from five different European countries who were absent for a day or more due to illness from 1991 to 2001.
The graph below shows the percentage of workers from five different European countries who were absent for a day or more due to illness from 1991 to 2001.
