Task 1
comparison/time
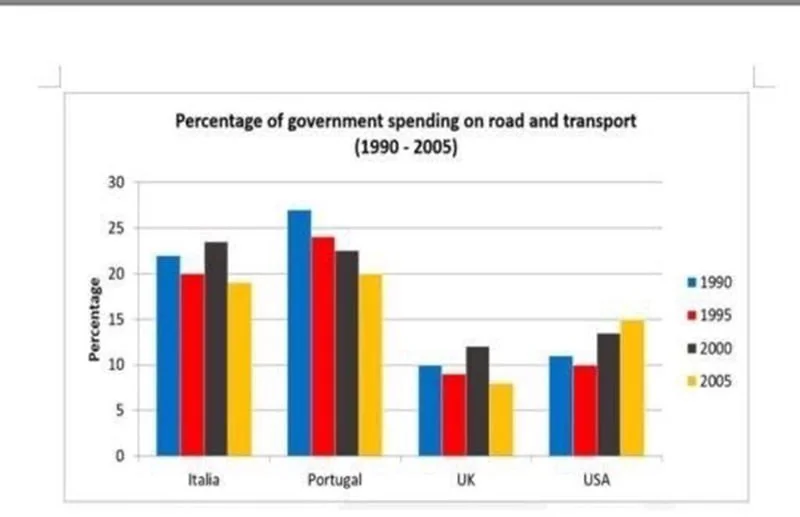
The chart shows the percentage of government spending on roads and transport.
Sample: The bar chart shows the proportional distribution of the state budget on road development and transportation in four countries between 1990 and 2005. The data suggest that spending in Italy an…
۱۴۰۵/۰۶/۲۹
مدیر سیستم