
بلاگ
مقالات و اخبار
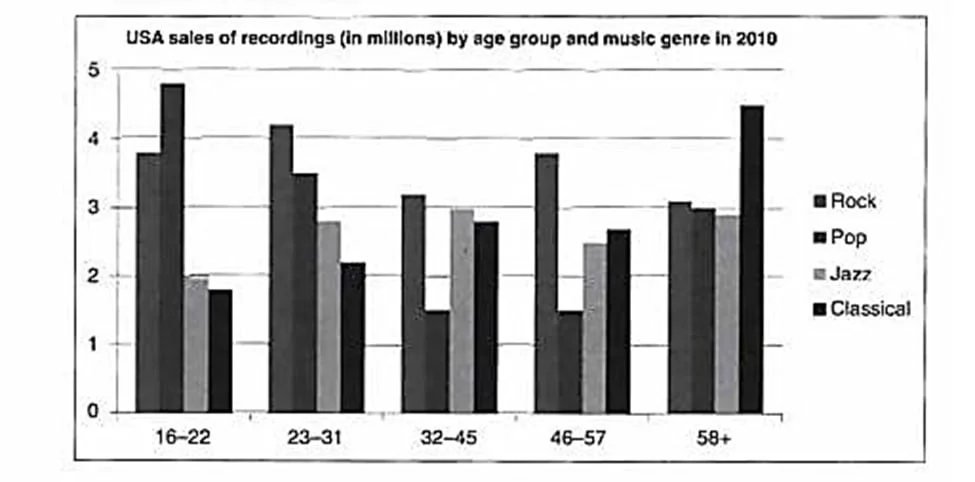
The chart below shows the types of music bought in the US in 2010 by age group.
The bar chart compares the sales of four music genres (in millions) among five age groups in the United States in 2010. The data suggest that Pop and Rock tended to attract younger buyers, while Jazz…
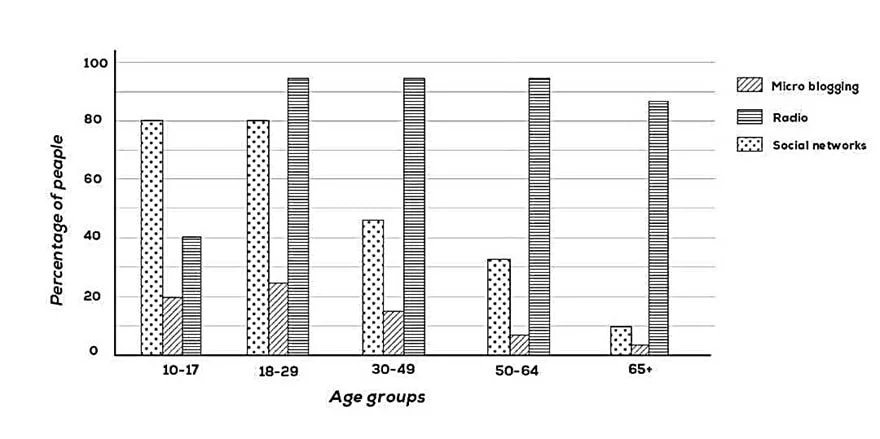
The chart shows the types of media that people of different age groups used to get daily news from in one country in 2011.
The bar chart shows how people of five age groups obtained their daily news in a country in the year 2011. The data suggest that reliance on social networking and microblogging to access news declined…
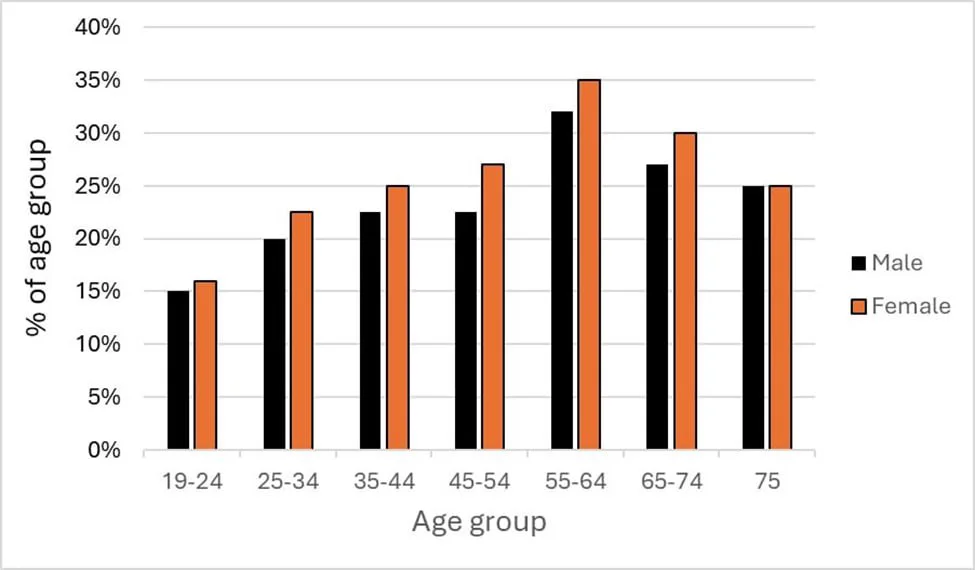
The chart below shows the percentage of males and females in the UK by age group who ate five or more portions of fruit and vegetables per day in 2006.
Sample: The bar chart shows the proportion of the UK s male and female population, categorized in seven age groups, who consumed meat-free food on a daily basis in the year 2006. The data suggest that…
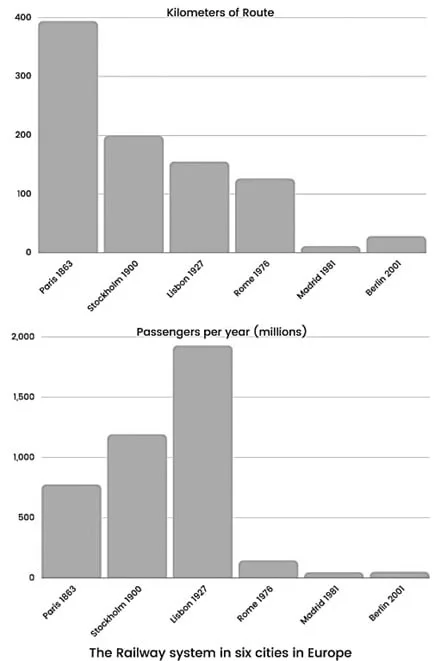
The bar charts below give information about the railway system and the dates they opened in six cities in Europe.
The bar charts show the subway systems in six European metropolises based on opening date, length (kilometers), and passengers (millions). The data suggest that the railways span positively correlates…
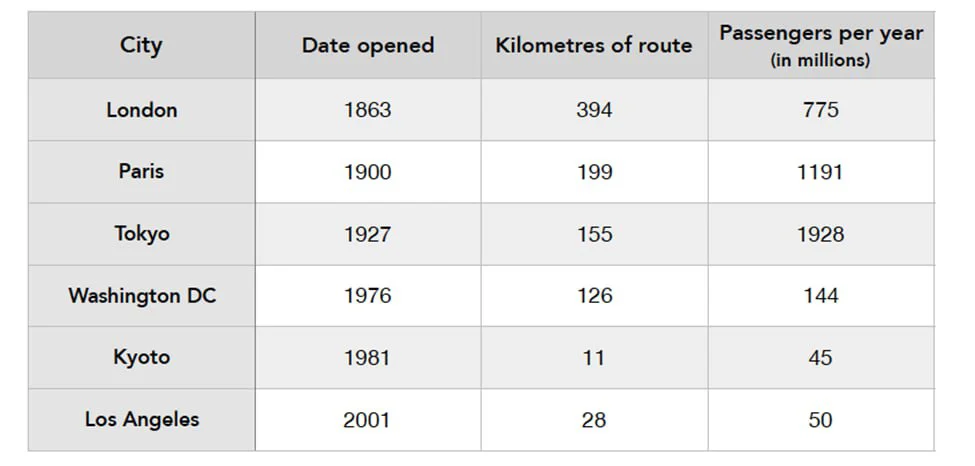
The table shows data about underground railway systems in six major cities with the date they opened, kilometers of route, and passenger numbers per year in millions.
The table shows the underground railway systems in six metropolises by opening date, length (km), and passengers (in millions) carried annually. The data suggest that a general positive correlation ex…
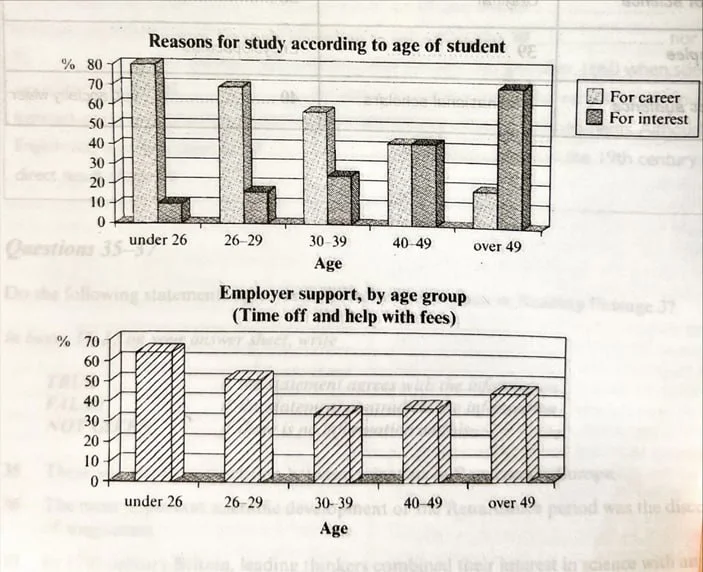
The chart shows the main reasons for study among students of different age groups and the amount of support they received from their employers.
The charts show two critical reasons for studying among students in five age groups and the level of support their employers provided. The data suggest that the younger the population was, the higher…
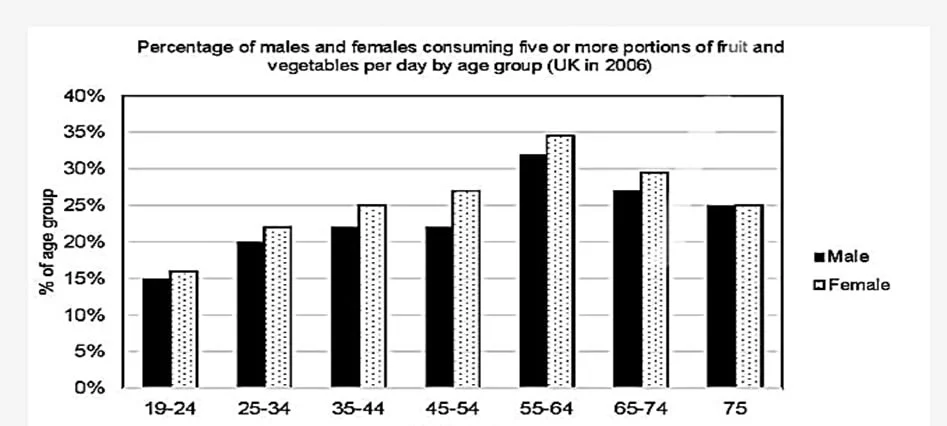
The World Health Organization recommends that people should eat five or more portions of fruit and vegetables per day. The bar chart shows the percentage of males and females in the UK by age group in 2006.
The bar chart shows the percentage of UK participants from both genders divided into seven age groups who consumed the recommended meat-free food (as announced by WHO) in 2006. The data suggest that w…
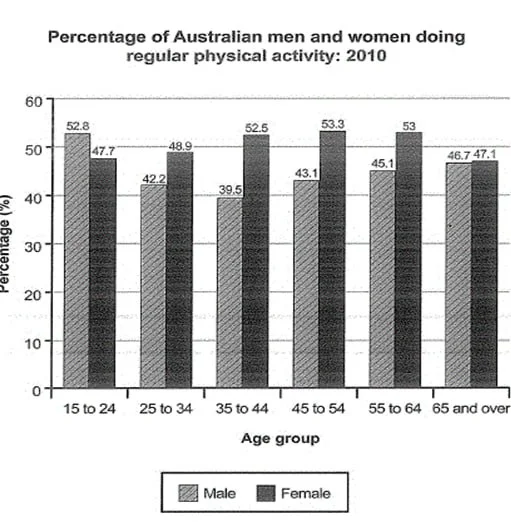
The bar chart shows the percentage of Australian men and women in different age groups who did regular physical activity in 2010.
The bar chart shows the proportions of male and female Australians in six age groups participating in routine exercises in 2010. The data suggest that while the level of involvement for men improved w…
