
بلاگ
مقالات و اخبار
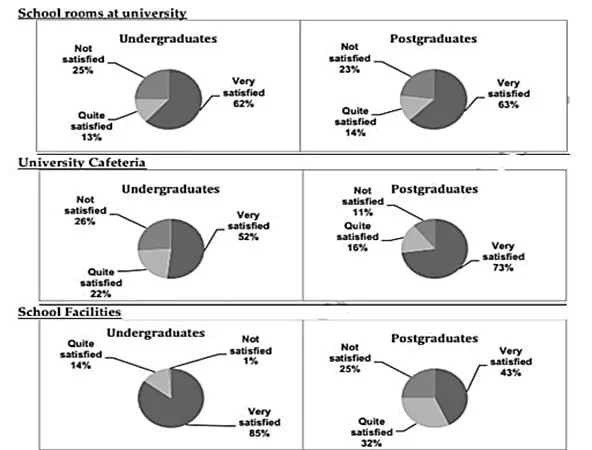
The charts provide information about students in 2007 who were happy with different facilities at a university in the UK.
The pie charts show the satisfaction levels of undergraduate and postgraduate students with different aspects of a UK university in 2007. The data suggest that although satisfaction was generally high…
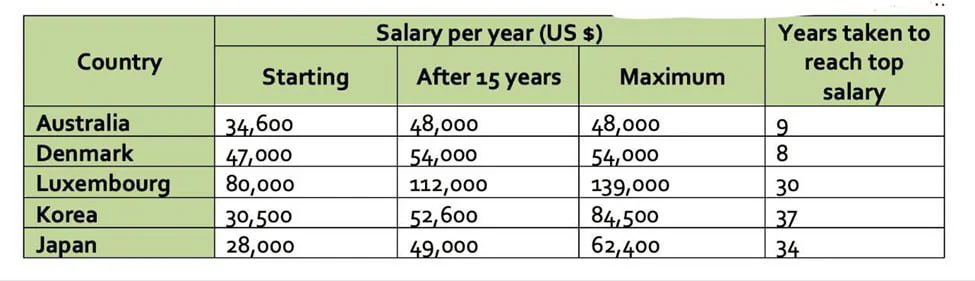
The table gives information about the salaries of secondary teachers in different countries.
The table presents information on starting salaries, earnings after 15 years, and maximum salaries for secondary teachers in five countries in 2009, together with the number of years required to reach…
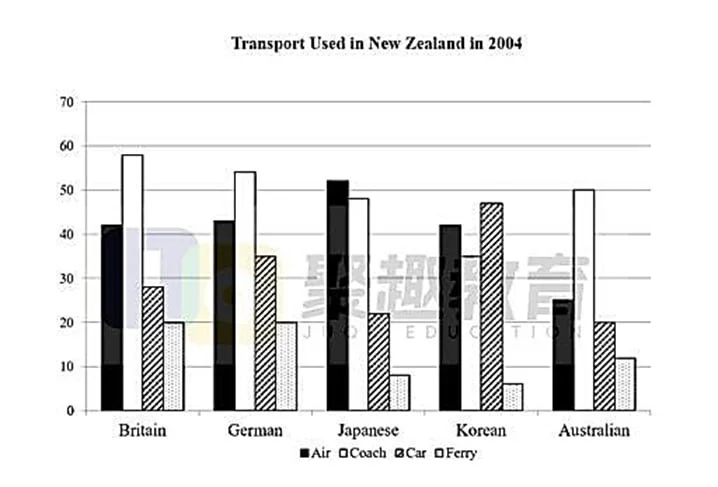
The graph shows the types of transport used by tourists who visited New Zealand from five countries in 2004.
The bar chart shows four kinds of transportation air, coach, car, and ferry and the frequency of their use by tourists from five nations in 2004. The data suggest two broad patterns: visitors from Bri…
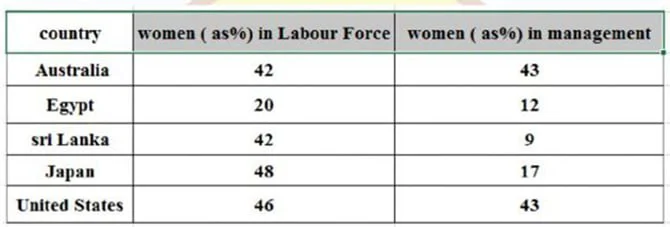
The table below shows the proportions of women in the labor force and in management across five countries.
The table shows the representation of females in the labor force and managerial positions across five nations. The data suggest that while the rates for the Australian and American female workers and…
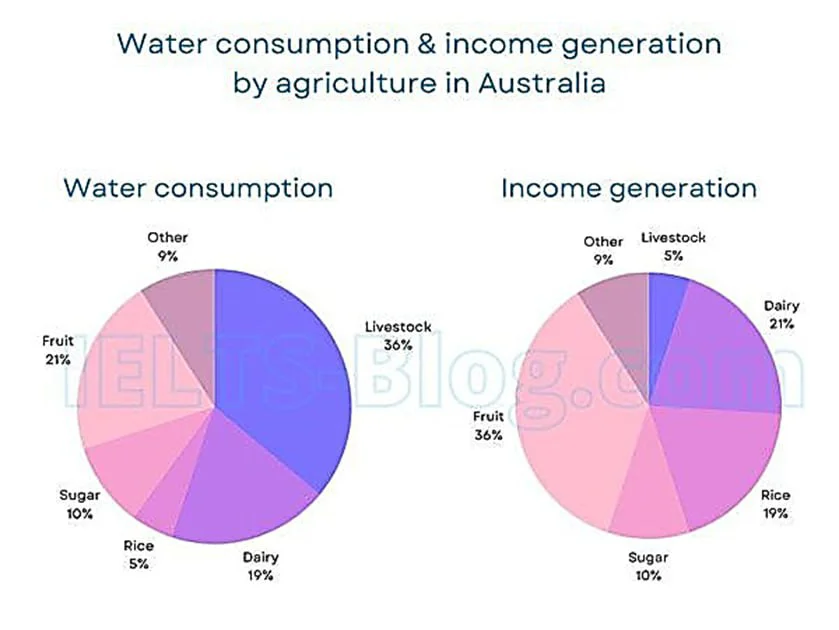
The charts below give information on the consumption of water by agricultural products in Australia in 2014, and the share of income they produced.
The pie charts show the percentage of water use for cultivating five agricultural products livestock, dairy, rice, sugar, and fruit and an unnamed category, along with the proportion of revenue these…
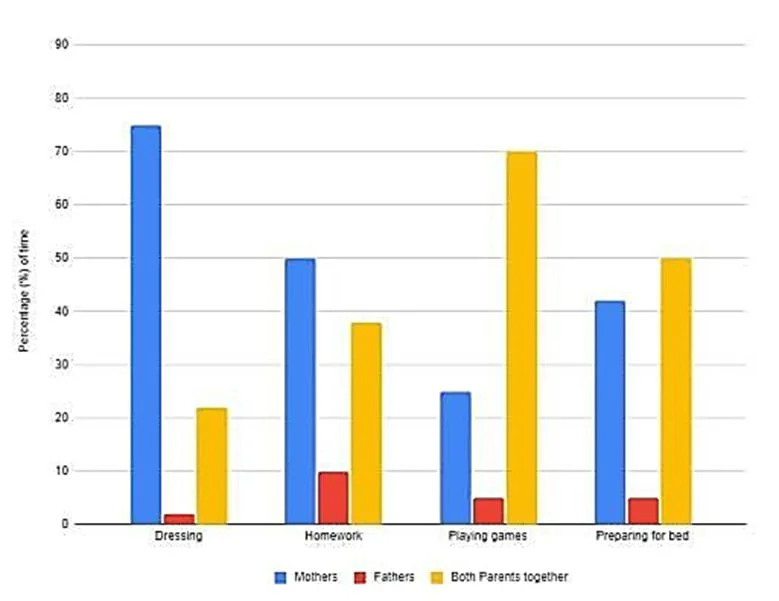
The chart shows the percentage of how parents in a country spent time taking care of their children in the evening in 2022.
Sample: The bar chart shows the proportion of parental involvement (percentage of time) categorized as mothers, fathers, and both parents in one country with evening childcare in the year 2022. The da…
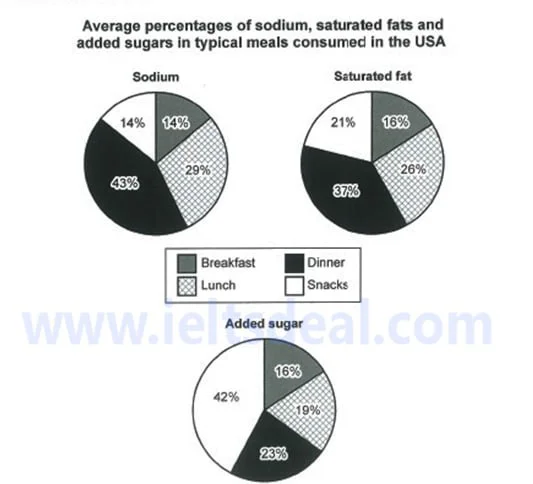
The charts show the average percentage in typical meals of three types of nutrients, all of which may be unhealthy if eaten too much.
The pie charts show the proportions of three potentially unhealthy substances, sodium, saturated fat, and added sugar, in four everyday meals in the US. Overall, lunch and breakfast show a balanced di…
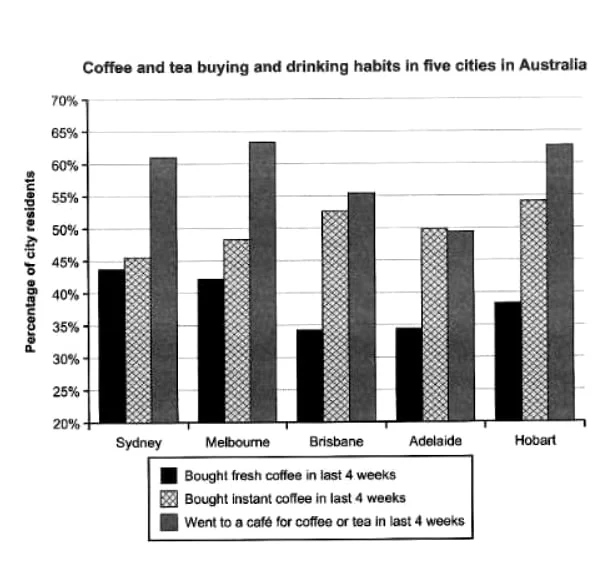
The chart shows the results of a survey about people’s coffee and tea buying and drinking habits in five Australian cities.
The bar chart shows people s tendencies to buy or drink coffee or tea in five cities in Australia in the last four weeks. Overall, the percentages of cafe visitors stand well above other tendencies in…
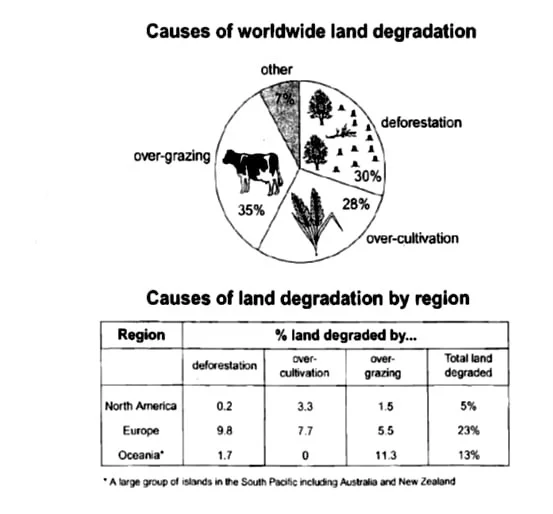
The pie chart below shows the main reasons why agricultural land becomes less productive. The table shows how these causes affected three regions of the world during the 1990s.
The pie chart shows three reasons along with a category of unlisted causes for the decline in the quality of agricultural land, and the table gives information on three regions suffering from the caus…
