
بلاگ
مقالات و اخبار

I examine and mark many essays every week, and when it comes to Coherence and Cohesion (CC), one thing stands out: The overuse of linkers.
I examine and mark many essays every week, and when it comes to Coherence and Cohesion (CC), one thing stands out: The overuse of linkers. I call it addiction to linkers. To combat this addiction, I p…
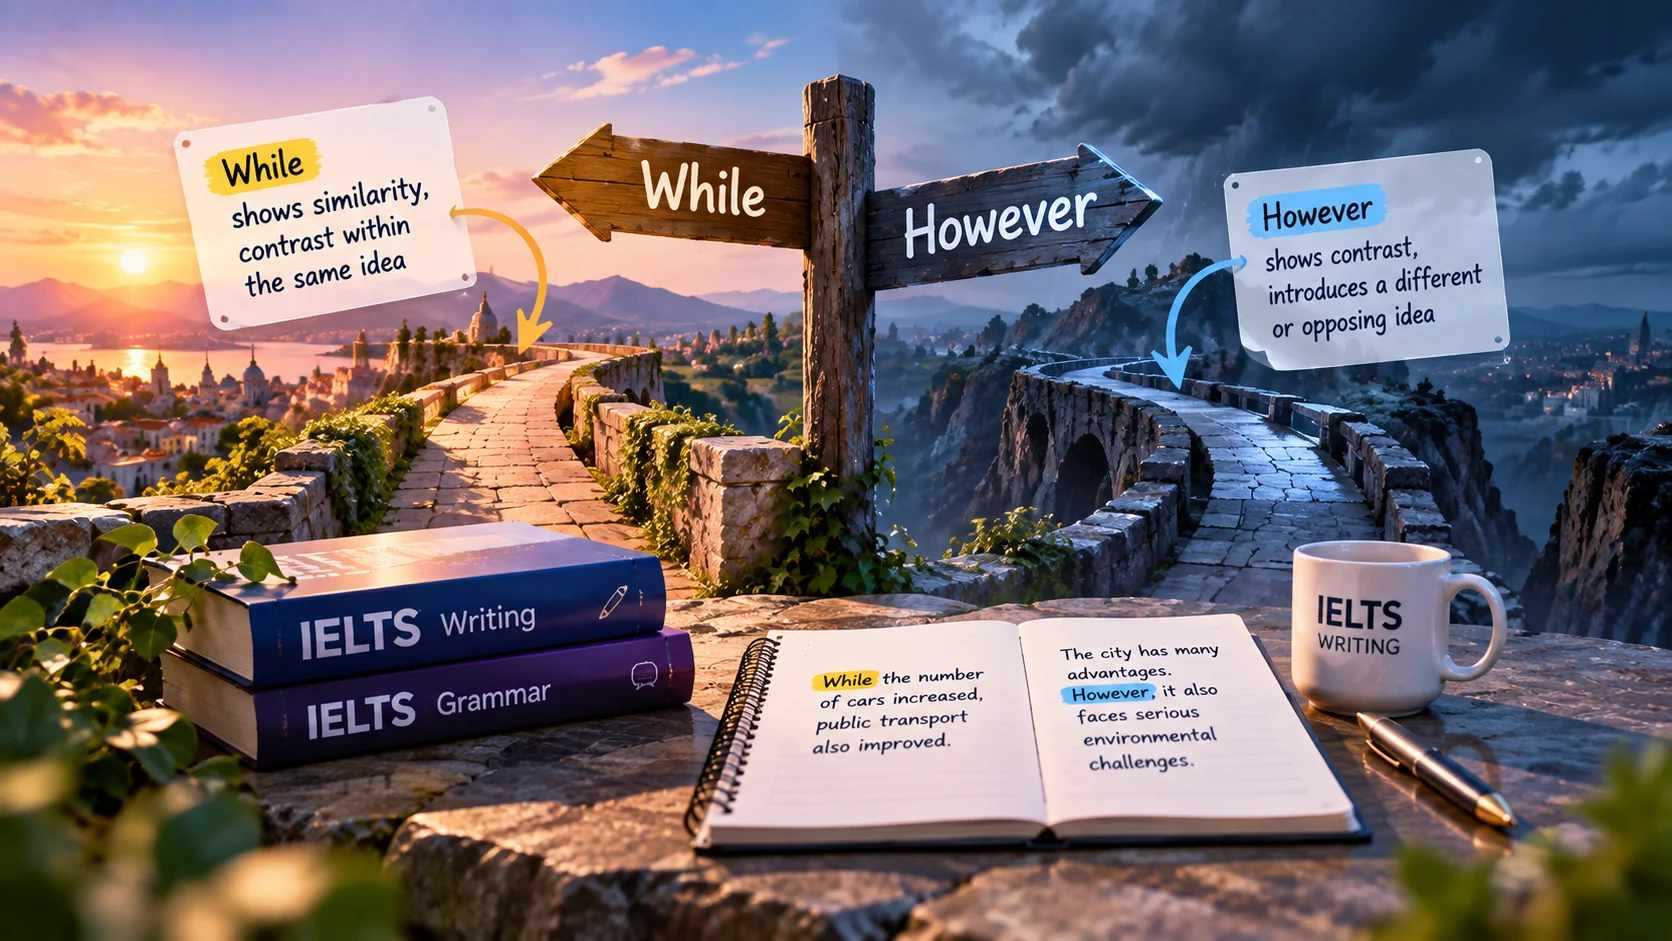
Cohesion within and between sentences (While vs. However)
Cohesion within and between sentences (While vs. However) While and However are both cohesive devices. They connect ideas, but not in the same way. While connects ideas within a sentence. However come…
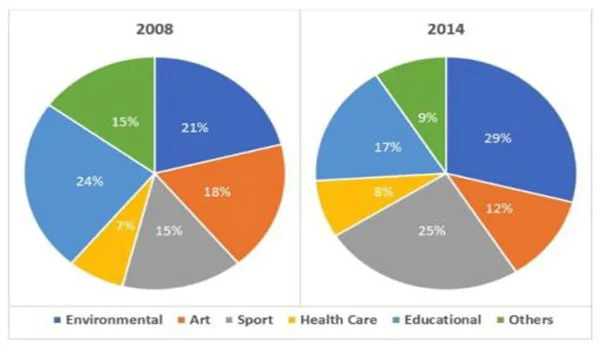
The charts show the percentage of volunteers by organizations in 2008 and 2014.
The charts show the percentage of volunteers by organizations in 2008 and 2014.
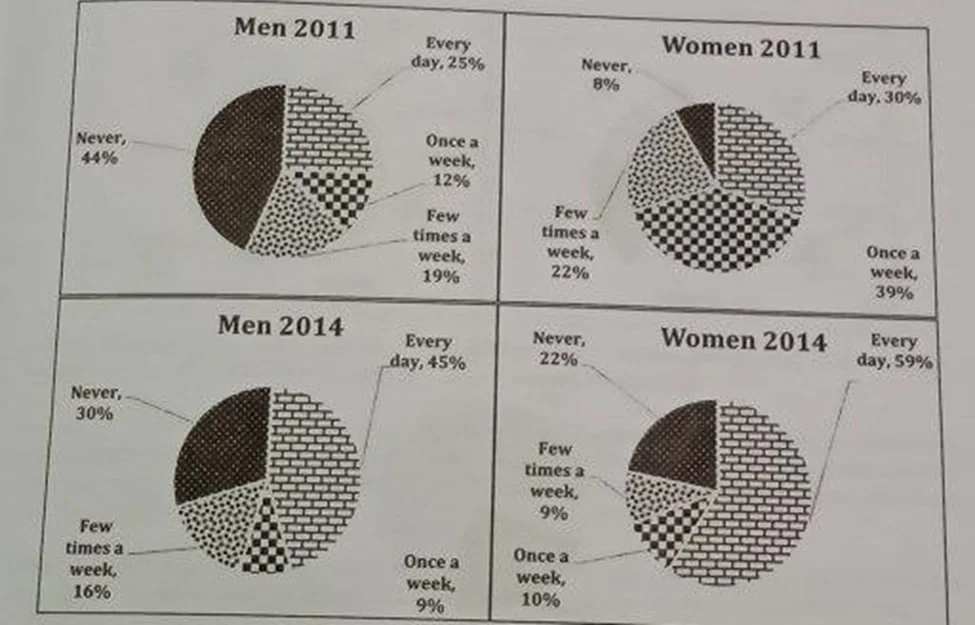
The charts show the use of social media by men and women in Australia in 2011 and 2014.
The charts show the use of social media by men and women in Australia in 2011 and 2014. The pie charts compare how men and women in Australia used social media in 2011 and 2014. The data suggest a nat…
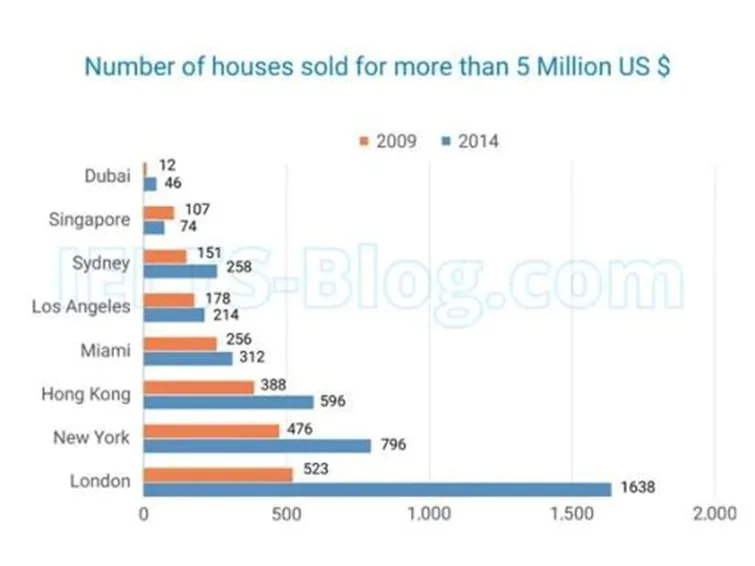
The chart below shows the number of houses sold in 8 cities in the world for more than 5 million US dollars in 2009 and 2014.
The chart below shows the number of houses sold in 8 cities in the world for more than 5 million US dollars in 2009 and 2014. An overview for the prompt above: 👆👆👆👆 The data suggest two distinct p…
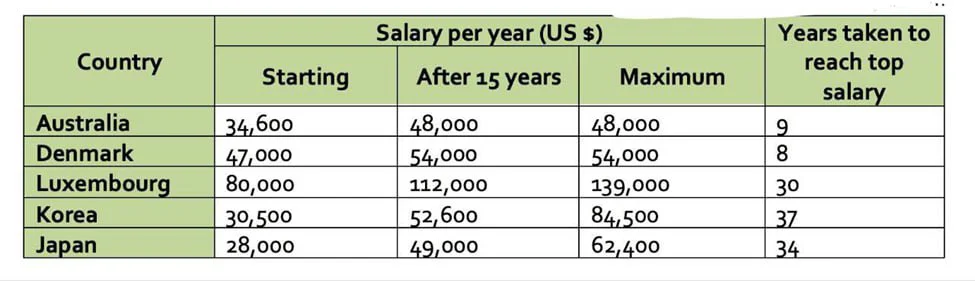
The table gives information about the salaries of secondary teachers in different countries.
The table gives information about the salaries of secondary teachers in different countries.
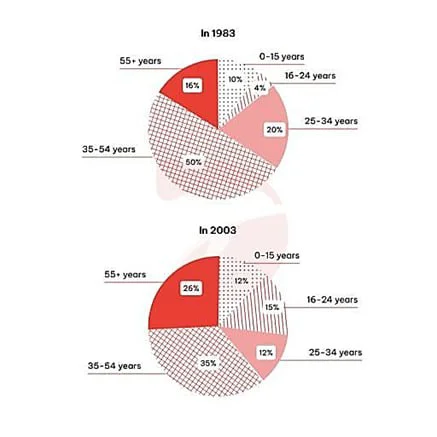
The charts give information about the age of visitors from the UK to Spain in 1983 and in 2003.
The charts give information about the age of visitors from the UK to Spain in 1983 and in 2003.
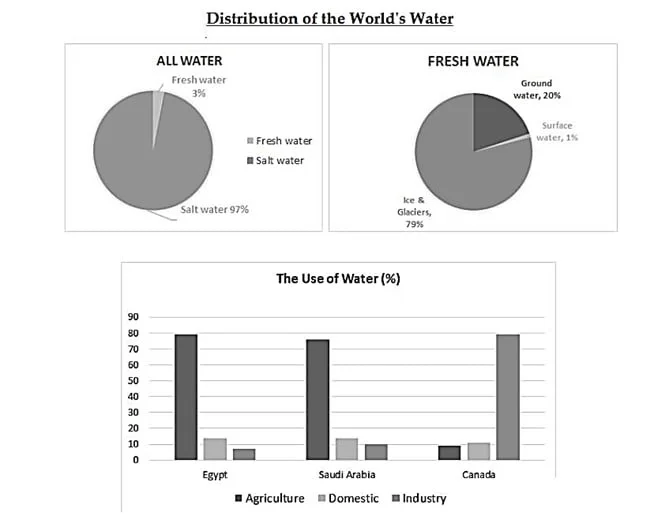
The pie charts show the global proportions of saltwater and freshwater, and the bar chart presents a breakdown of water use in agriculture, households, and industry in Egypt, Saudi Arabia, and Canada.
The pie charts show the global proportions of saltwater and freshwater, and the bar chart presents a breakdown of water use in agriculture, households, and industry in Egypt, Saudi Arabia, and Canada.…
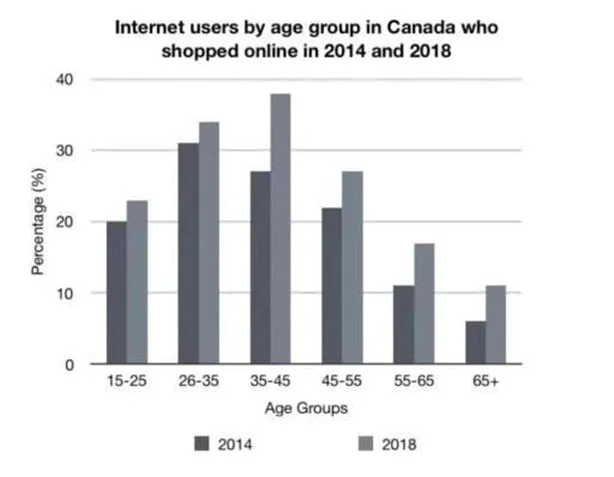
The chart below shows the percentage of internet users by age group in Canada who shopped online in 2014 and 2018.
The chart below shows the percentage of internet users by age group in Canada who shopped online in 2014 and 2018. The bar chart shows the proportion of Canadian internet users in six age groups who e…
