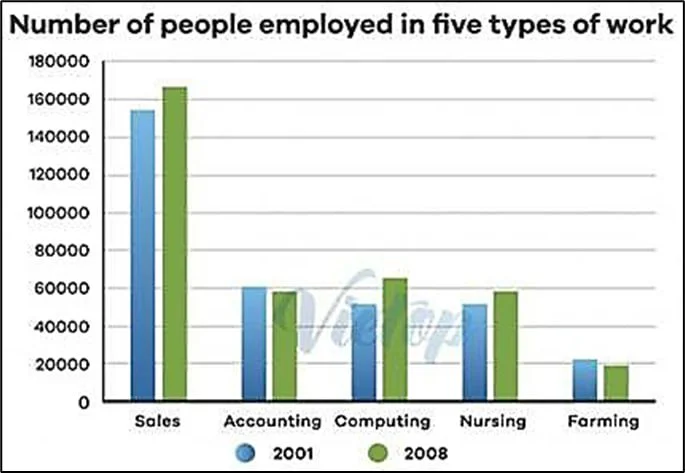
The chart shows the number of people employed in five types of work in a certain region in Australia in 2001 and 2008.
The bar chart shows employment rates across five career types in an area of Australia in two years: 2001 and 2008. The data suggest that while sales exhibited unmatched figures and agriculture showed minor records as outliers, the numbers for the job types in between fell within a similar range, with rates varying between the two years.
Beginning with the outliers, not only was the difference between them vast, but also their changes were dissimilar. Sales showed a massive record of slightly above 150 thousand employees, which even rose by about 20,000, whereas the figures for those involved in farming were about 8 times lower, with a marginal decrease over time.
The similar track records of accounting, computing, and nursing ranged from approximately 50 to 60. The former saw a slight decline from 60 thousand accountants, while the latter two fields began with similar records and increased somewhat similarly, with computing slightly exceeding 60,000 and nursing barely reaching the same figure.