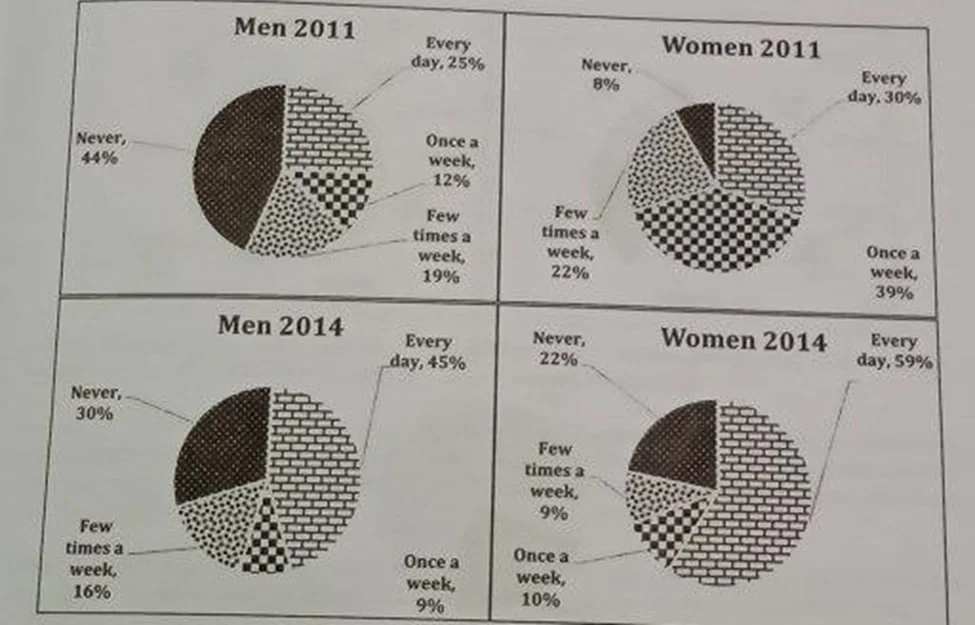
The charts show the use of social media by men and women in Australia in 2011 and 2014.
The pie charts compare how men and women in Australia used social media in 2011 and 2014. The data suggest a nationwide shift toward daily usage for both genders and a collapse in mid-frequency engagement, particularly among women. Another clear pattern is a divergence among non-users: the proportion of men who never used social media declined, whereas the figure for women rose noticeably.
Among men, daily engagement almost doubled, rising from 25% to 45%, while the proportion who never used social media fell from 44% to 30%. Meanwhile, occasional use diminished: weekly engagement dropped from 12% to 9%, and using social media a few times a week decreased from 19% to 16%.
Women showed a more polarized pattern, with increases in both heavy users and non-users. Their daily use rose sharply from 30% to 59%, the largest increase among all groups. At the same time, the proportion who never used social media increased from 8% to 22%. Mid-frequency engagement declined steeply: weekly use fell from 39% to 10%, and use a few times a week almost halved to 9%.