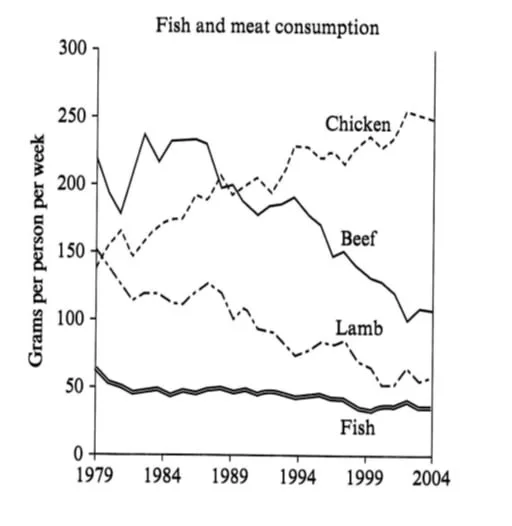
The graph shows the consumption of fish and some different kinds of meat in a European country between 1979 and 2004.
The line graph shows the quantity of four types of meat—fish, lamb, beef, and chicken (measured in grams per person per week)—in a country in Europe from 1979 to 2004. The data suggest that while the consumption of red meat (beef and lamb) declined significantly, albeit not consistently, chicken consumption rose sharply, whereas the trend for fish exhibited minor changes and remained the least prevalent.
By the end of the period, beef and lamb had fallen to approximately half their initial amounts. The former, which was the most consumed type at the beginning, started around 220, reached a peak of nearly 250 sometime around 1984, and then experienced an unsteady decline throughout the rest of the period. In contrast, the latter began at 150 and decreased, sometimes inconsistently, until the end.
By contrast, the consumption of white meat showed different trends. The figure for chicken use started at about 150 (the third most used meat) and rose sharply, fluctuating throughout the period, to an all-time high of roughly 250 in 2004. However, the figure for fish remained the lowest, at about 50, and showed negligible changes over time.