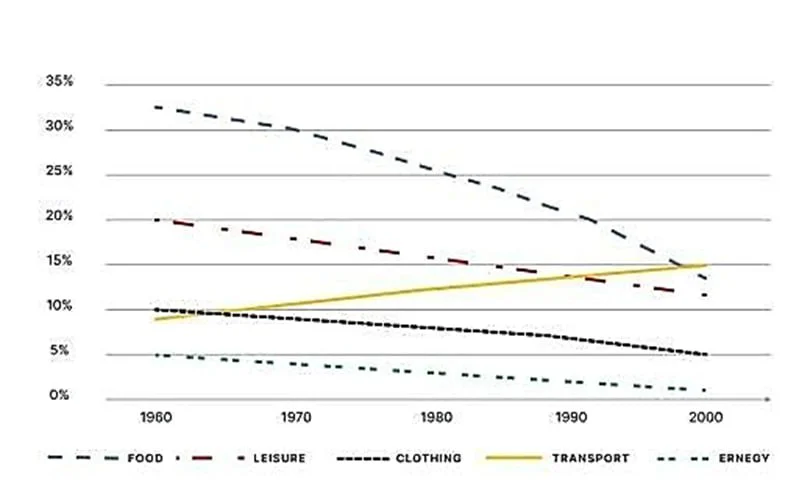
The graph shows the percentage of spending in a European country from 1960 to 2000.
The line graph shows the proportion of money spent on five categories of items in a country in Europe between 1960 and 2000. The data suggest that the high-range items, namely food and leisure, exhibited falling and converging trends, whereas the low-range items showed dissimilar tendencies, with transport rising sharply, unlike clothing and energy.
Expenditure on food and leisure dominated in 1960, with the former accounting for approximately one-third of total spending and the latter for 20%. However, the rates for both declined, with the former exhibiting a sharper fall, and converged to approximately 12% by the end, although the rate for leisure was slightly lower.
By contrast, the landscape for lower-range spending was somewhat different. The figure for clothing, which was twice as significant as the 5% for energy, decreased by half as steadily as the spending on energy, which neared zero. In stark contrast, the percentage of money spent on transport rose from barely 10% to a level slightly higher than those reported for food and pleasure.