
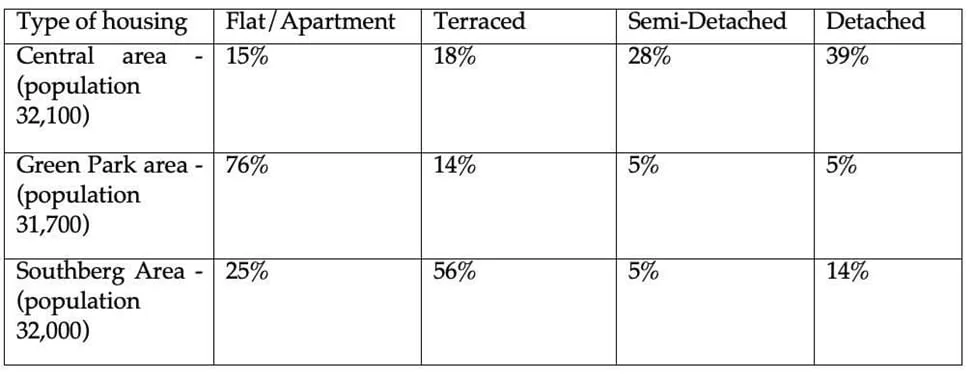
The table below shows the percentage of the population and the types of houses they live in 3 areas of a city.
The table shows the population of citizens and their chosen housing types in three parts of an unnamed city. As the data suggests, the distribution of figures in the Central area skews more towards physically separate housing types, while the opposite is true in Green Park and Southbern, with the latter exhibiting a less regular data distribution.
In the Central Area, with apartments and terraced houses, the figures average 16.5% of the total population (32100), while the average rate is roughly twice as high for housing types that are physically more distant from each other, namely semi-detached and detached accommodations.
Conversely, in Green Park, the tendency to live in apartments and terraced houses is higher. In fact, an unrivaled 76% of 31700 people live in apartments, followed by only 14% in terraced houses, whereas only 10% of the residents reside in other types. Similarly, a larger proportion of 32000 residents in Southberg live in apartments and terraced houses, the only difference being that the proportion reported for apartments (25%) is roughly half that of terraced houses, with the rest living in semi-detached and detached houses at 5% and 14%, respectively.
