
- Type of prompts in Task 1
- Reporting similarities and differences:
- static data
- no change
- size (figures or percentages)
- Comparison and contrast
- Reporting changes over time
- Continuous time period
- Size (figures or percentages)
- Change (increase, decrease, little change)
- Amount of change (double, triple, significant increase, half as much…)
- Data behavior (steady, sharply, or moderately)
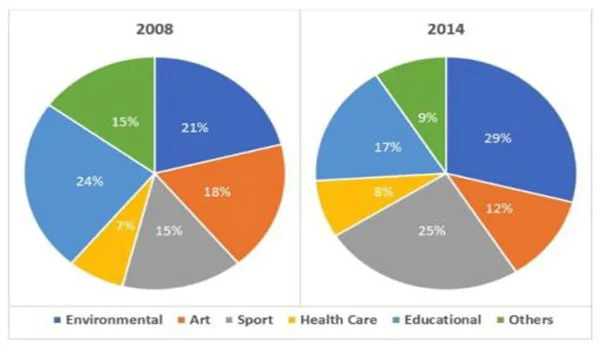
- Non-continuous: two or three individual years
- Size (figures or percentages)
- Change (increase, decrease, little change)
- Amount of change (double, triple, significant increase, half as much…)
- Maps (often)
- Reporting the relationship between X and Y
- A bar chart showing X and Yo
- Distribution table
- Reporting a mix of two of the above
- Two separate graphs
- One integrated graph
- Reporting processes
مطالب مرتبط


نظرات
هنوز نظری ثبت نشده. اولین نظر را شما بنویسید!
برای ثبت نظر وارد شوید
