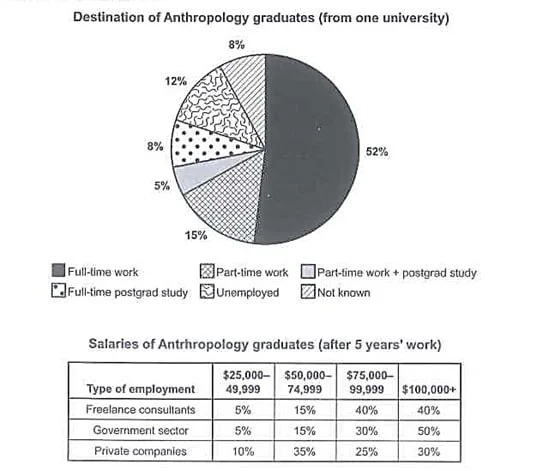
The pie chart shows the six destinations of anthropology undergraduates, and the table shows their salary range in three types of employment after five years of employment. Overall, a markedly higher percentage of anthropology graduates entered job markets than those opting to further their education, and compared to private firms, a much higher rate of independent contractors and public servants received higher salaries after five years of employment.
Regarding the pie chart, the figure for full-time employees boasts 52%, followed by part-time workers (a humble 15%). By contrast, postgrad study (full-time or otherwise) attracted merely 5% to 8%, and other than the 12% unemployed, the remaining share was not accounted for.
After five years of employment, the percentages of those in government and freelance sectors positively correlated with salary classes. Both types attracted 80% of the anthropologists in the two highest-paying ranks, although the six-figure earners are 10% higher in the government sector. Among private companies, however, the difference between the two low-end and high-end payments is only 5%, with more significant percentages at the higher end.