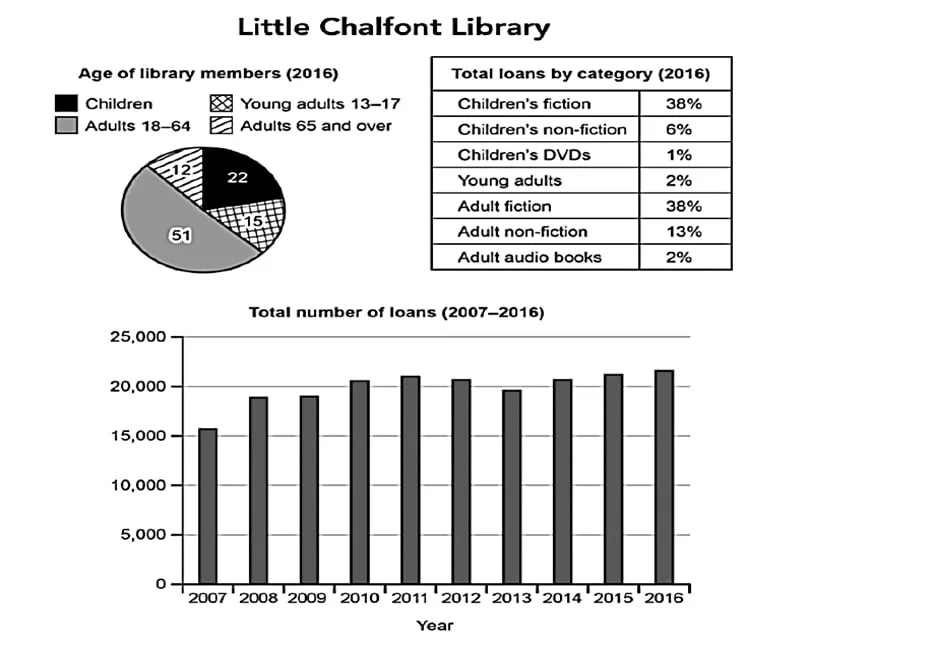
The pie chart and the table show the proportional distribution of library members across four age groups and the breakdown of loans across seven categories in Little Chalfont. The bar chart shows the total number of loans from 2007 to 2016. Adults formed the majority of members, followed by children, teenagers, and older adults. However, borrowing patterns differed markedly from membership figures, with children’s total borrowing far exceeding their share of members and approaching the scale of adult borrowing. The total number of loans increased overall, though the rise was irregular.
Adults aged 18 to 64 accounted for 51% of members, while children made up 22%. Teenagers and those aged 65+ represented smaller proportions at 15% and 12%, respectively. Borrowing data show a strong emphasis on fiction, with children’s fiction alone constituting 38% of total loans, and their non-fiction and DVD categories adding a further 7%. Adult fiction made up another 38%, followed by adult non-fiction at 13% and audiobooks at 2%. Loans by young adults accounted for only 2%.
Regarding total library usage over time, borrowing began at just above 15,000 in 2007 and rose to slightly over 20,000 in 2016. This growth was not steady, with a small pause and decline occurring between 2008 and 2009 and again from 2012 to 2014, respectively, before recovering in the final years.