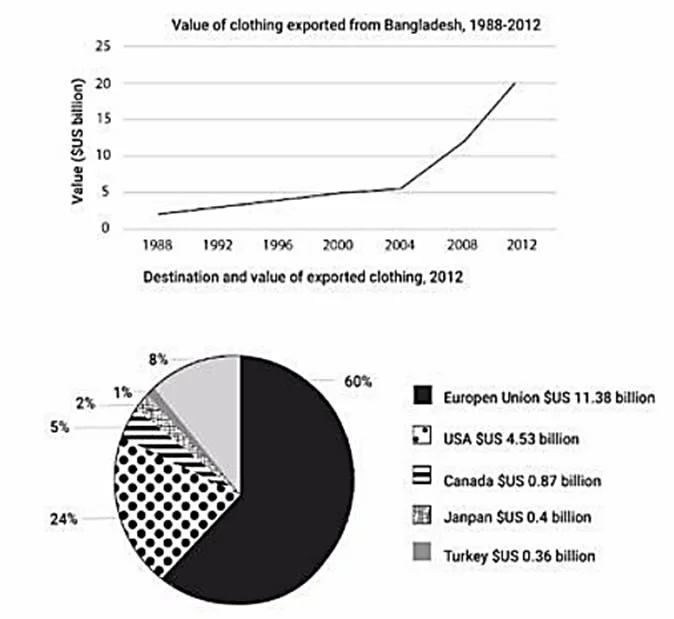
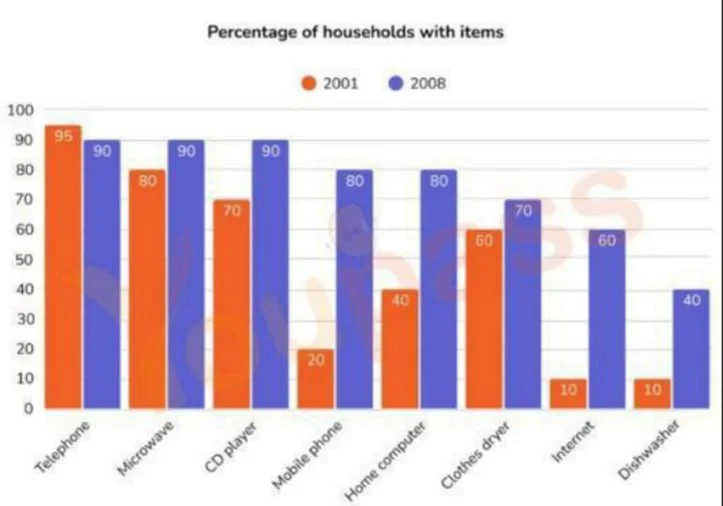
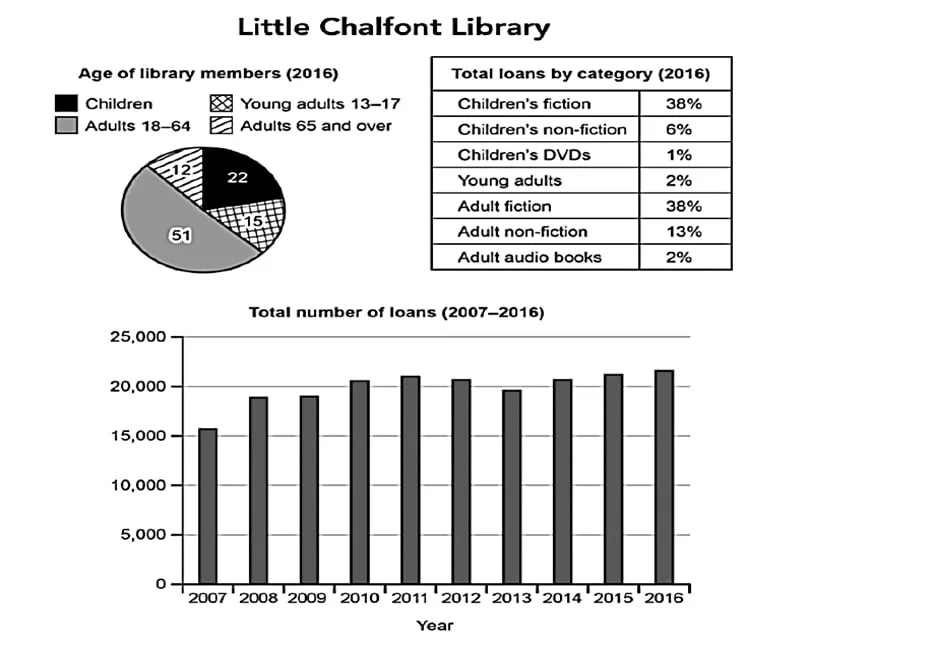
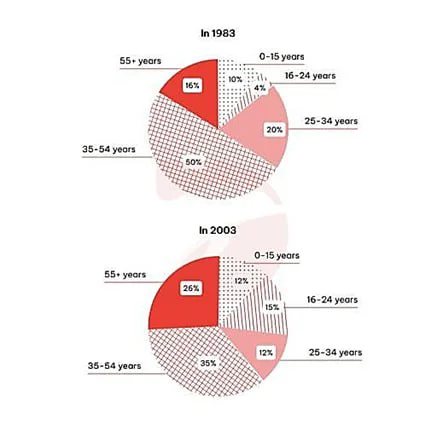
The line graph shows the value of Bangladesh’s clothing exports from 1998 to 2012, while the pie chart compares the distribution of these exports across five markets in 2012. The figures indicate that, after a long period of slow and steady growth, the export value rose sharply from the mid-2000s onwards. The 2012 data also show a highly concentrated market structure, with the European Union and the United States accounting for the overwhelming majority of export demand.
At the start of the period, export earnings were just over US$2.5 billion, and increases remained relatively modest until 2004, when the figure reached about US$5 billion. After this point, growth accelerated dramatically: exports doubled between 2004 and 2008, and by 2012 the value had climbed to nearly US$25 billion.
The market distribution in 2012 was dominated by the European Union, which absorbed 60% of all exported clothing, amounting to US$11.38 billion. The United States was the second-largest destination, taking 24% (US$4.53 billion). By contrast, the remaining destinations—Canada, Japan, and Turkey—represented only small shares, at 5%, 2%, and 1%, respectively, each with export values well below US$1 billion.