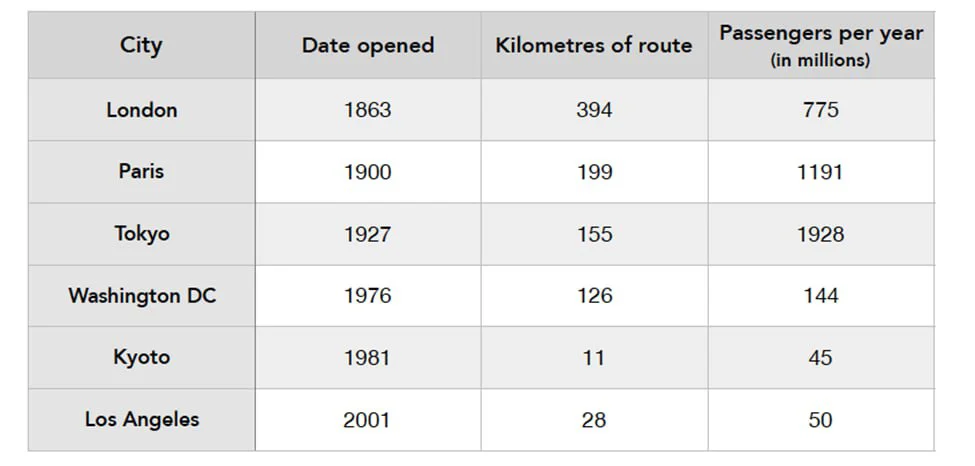
The table shows the underground railway systems in six metropolises by opening date, length (km), and passengers (in millions) carried annually. The data suggest that a general positive correlation exists between subway length and age, whereas served passengers and age broadly correlate negatively in the three oldest subways on top of the list.
The length of the railway system in London, dating back to the mid-19th century, was 394 km – the largest figure. In Paris, which opened at the turn of the 20th century, the length was roughly half as long. This trend can also be observed in the remaining railway systems, listed in decreasing order of their recency, with their lengths diminishing to the point that in Kyoto, it is only 11 km.
Regarding passenger capacity, two opposite trends can be observed. In the first three cities, the numbers decline with age, starting from 775 million served in London (the oldest system) to a significant record of 1928 in Tokyo, built roughly seven decades later. Conversely, among the most recent railways, fewer passengers are served as time advances. For instance, compared to Washington in 1976, the more recent facilities in Kyoto and Los Angeles serve only one-third as many passengers, averaging 47.