Task 1
comparison
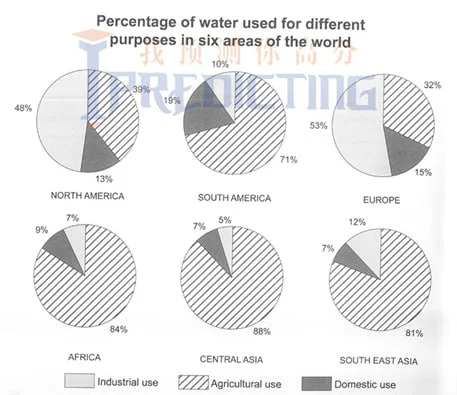
The charts below show the percentage of water used for different purposes in six areas of the world.
The pie charts show the proportional water distribution for three uses in six parts of the world. Overall, while four of the areas share broad similarities in the massive use of water for agriculture,…
۱۴۰۵/۰۶/۲۹
مدیر سیستم