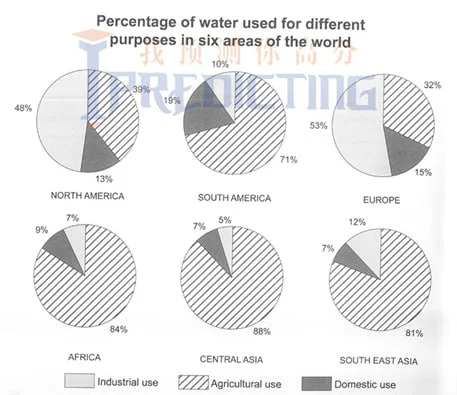
The pie charts show the proportional water distribution for three uses in six parts of the world. Overall, while four of the areas share broad similarities in the massive use of water for agriculture, the share for the industry is largest only in the remaining regions, with the domestic purpose never being the highest.
Concerning agricultural use, Central Asia, Africa, and Southeast Asia boast an average of 84%, followed by South America, which is roughly 10% lower. The remaining regions use only approximately one-third of their water resources for this purpose.
Regarding industry, this mode consumes roughly half of the water supply in Europe and North America, whereas in Southeast Asia and South America, this purpose accounts for merely 12% and 10%, respectively. The remaining regions consume only a fraction of the total.
Domestic use shows a notably different pattern, accounting for 19% in South America – the only significant record for this. Europe and North America follow with 4% and 6% smaller rates, respectively, followed by the amounts in other regions, at about just less than one-tenth of the total.