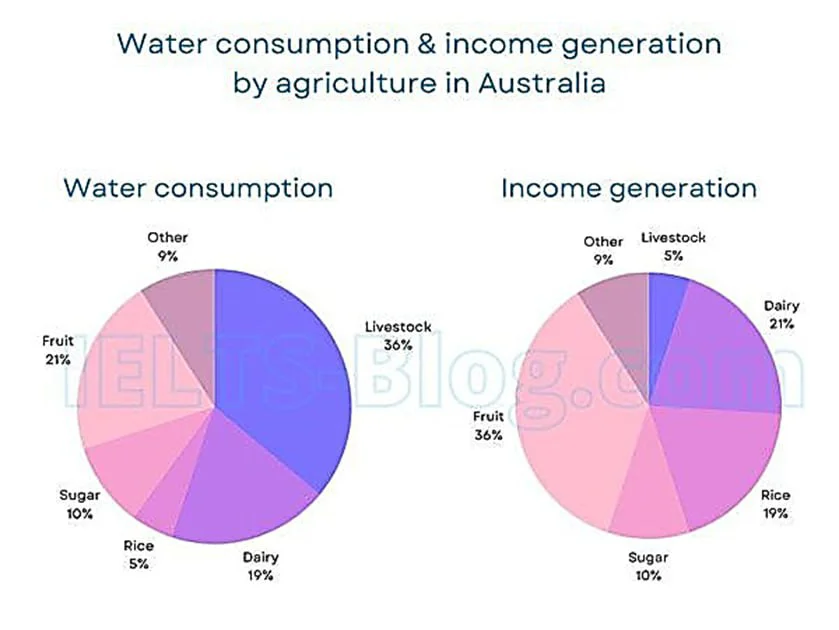
The pie charts show the percentage of water use for cultivating five agricultural products — livestock, dairy, rice, sugar, and fruit — and an unnamed category, along with the proportion of revenue these goods generated in the Australian economy in 2014. The data suggest that there was no perfect correspondence between water consumption and income generation, with livestock, rice, and fruit showing imbalances in the reported figures, although animal farming was notably less efficient than rice and fruit.
Livestock consumed a massive 36% of total water yet accounted for only 5% of the economy. Rice and fruit were the opposite in that they consumed 5% and 21% of water, but their impact on the economy was approximately 4 and 2 times larger, respectively.
The data landscape for other products was somewhat different. Diary’s water use accounted for 19%, with its revenue capacity only a few percentage points higher. This was followed by sugar and other unlisted products, whose figures were approximately half those of dairy, and whose economic impact was the same as their water consumption rates.