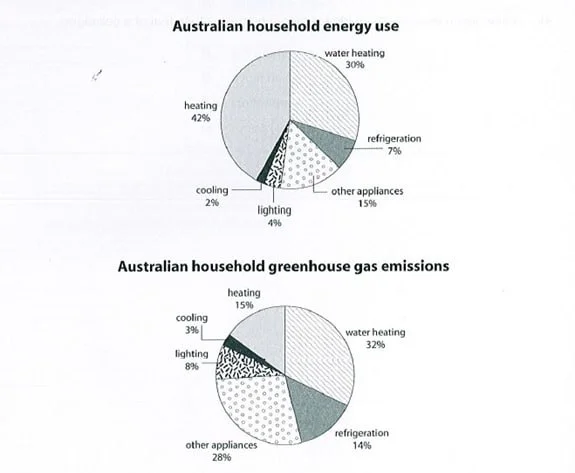
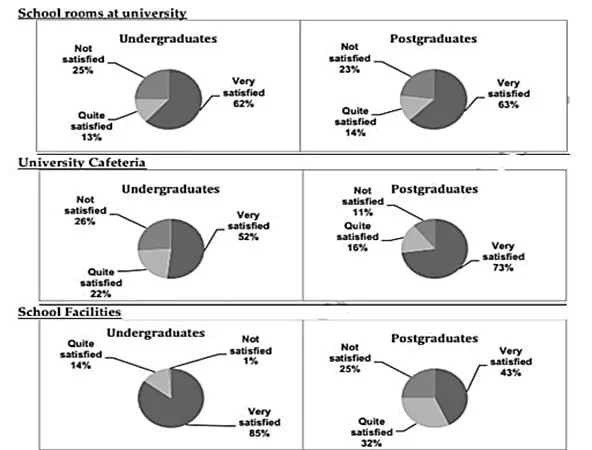
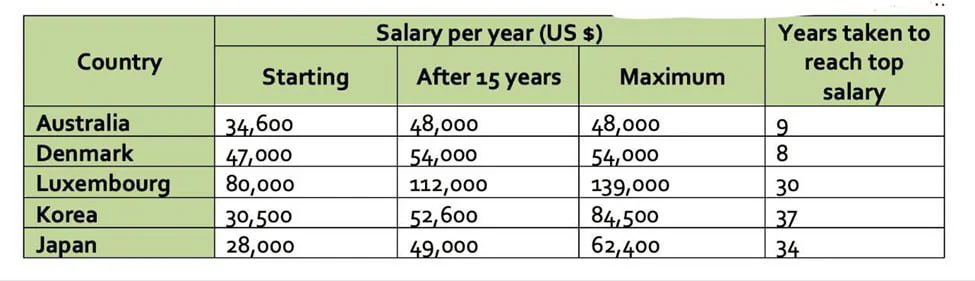
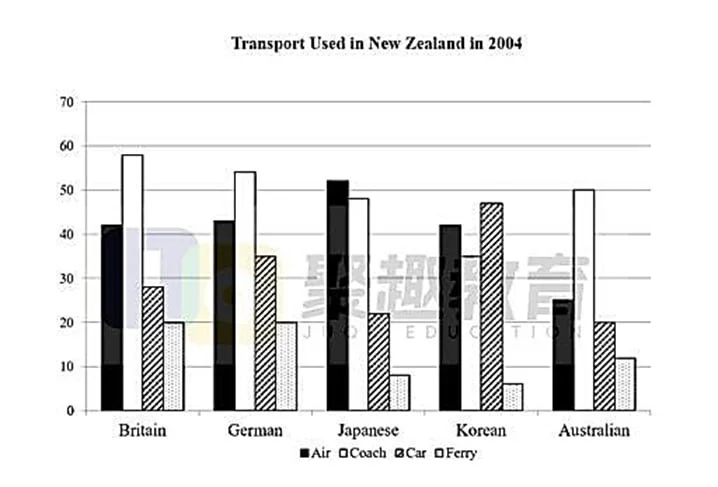
The graphs show the proportions of five main energy uses, as well as a category of unspecified appliances, and their resultant CO2 emissions in an average Australian household. The data suggests that of the six categories, water heating and heating account for unrivaled percentages, while they cause half of the total pollution, and the relationship between rates of other uses and their CO2 is generally disproportionate.
Heating is the only use whose consumption rate is substantially higher than the figures for its pollution. It is the lion’s share among other categories, at 42%, resulting in only 15% of the total greenhouse gases.
By contrast, heating water and cooling are the only categories with similar rates of use and CO2 emissions. The former is the second most prominent use of energy (30%), and the latter is only a fraction – 2% - both causing merely a few percentage points higher toxic gases than their uses.
The remaining categories, on average, cause twice as much pollution as their use. In ascending order, lighting, refrigeration, and other unnamed appliances range between 7% and 15%, with approximately twice as great CO2 outputs as their consumption patterns.