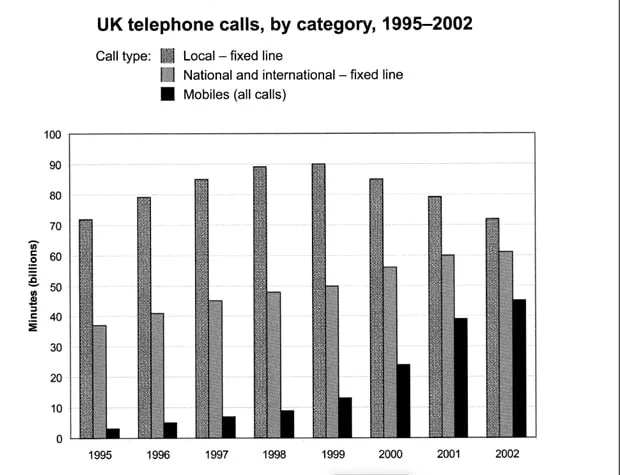
The graph shows call durations (in billions of minutes) in three categories in the UK between 1995 and 2002. The data suggests that mobile calls experienced the most significant increase despite remaining third in the rankings. Similarly, non-local calls grew gradually, remaining second in rank, but the most prominent figures belonged to local calls, whose steady growth saw a considerable decline in the new century.
The most salient trend is the similarity of mobile and non-local calls on fixed lines. The former grew exponentially to around 45 in 2002, with an initial record of merely around 5. The national and international categories also increased gradually (although less dramatically), from below 40 to about 60, still retaining their initial ranking.
By contrast, local calls made over landlines followed a different pattern. In the late 20th century, just over 70 billion minutes were spent on such calls, the highest record. This record gradually grew, peaking in 1999 at 90, which declined noticeably in the new century, falling to the same sum as at the beginning.