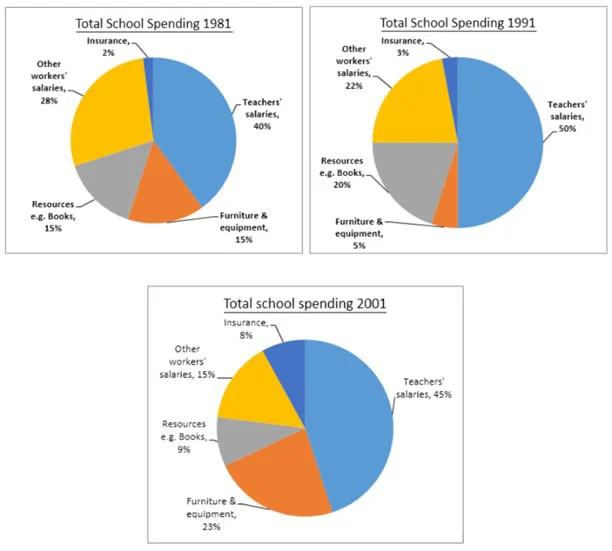
The pie charts show the proportional distribution of a school's total spending in the UK across five categories for the years 1981, 1991, and 2001. The data suggest that salaries for teachers and employees, combined, remained the largest expenditure throughout the period, with a significant increase in the 90s and a reduction in the final decade. This was followed by expenses for resources and infrastructure, which, combined, showed the highest percentage in the final year, after a contraction in the 1990s, with insurance costs rising uninterruptedly.
Regarding the dominant cost for staff, teachers' salaries accounted for half of the total expenditure in the 1990s, a 10% increase. This rate receded by 5% in the final decade. By contrast, the figures for employees exhibited a continuous decrease and almost halved in 2001 to reach 15%.
However, the spending on the non-human aspects of the school showed a different pattern. Resources peaked at 20% in the second decade (a 5% increase), which then fell to merely 9%. By contrast, infrastructure spending peaked in the final year, reaching 23%, representing a significant increase from only 5% a decade earlier, which itself was three times less than the initial figure. As for risk management, although the insurance cost was relatively marginal, its increase was fourfold, from 2% to 8%. This rose by only 1% over a decade and peaked at the end of the period.