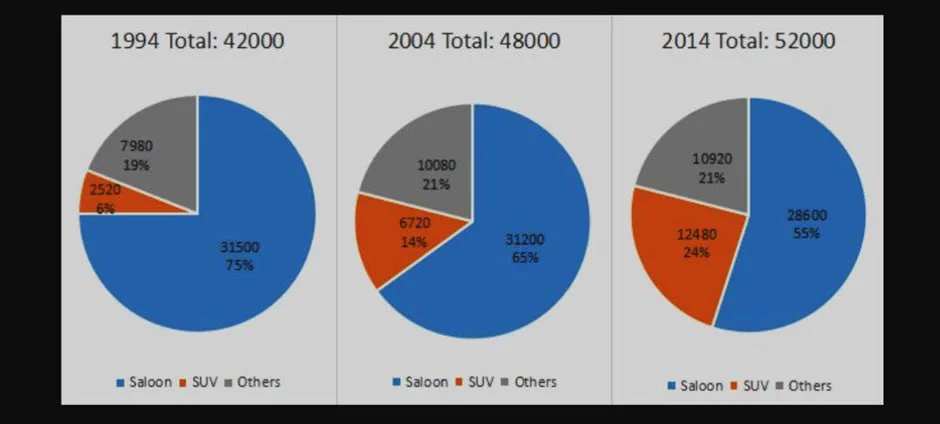
The pie charts show changes in the number and sales distribution of saloons, SUVs, and other unspecified car types in Australia in April over three years: 1994, 2004, and 2014. The data reflect an increase in car sales and a shift in customer preferences: saloons lost market share despite their continued dominance, while SUVs saw significant sales growth, with other car types generally stable.
Initially, saloons accounted for 75% of sales—31,500 units out of 42,000—representing a clear majority. A decade later, their market share dropped by 10%, with a slight decrease in units sold—just 300 fewer than before, despite an increase in total sales to 48,000. Sales continued to decline, dropping another 10% in market share and fewer units sold—28,600 out of 52,000.
In contrast, by the end of the period, the SUV market had roughly quadrupled from the initial 6%, with the volume sold also experiencing significant growth: 2,520, 6,720, and 12,480, respectively, over time. Similarly, unspecified car types showed an increase, though less pronounced, accounting for 19% before the turn of the century and remaining at 21% afterward, with totals of 7,980, 10,080, and 10,920 sold cars.