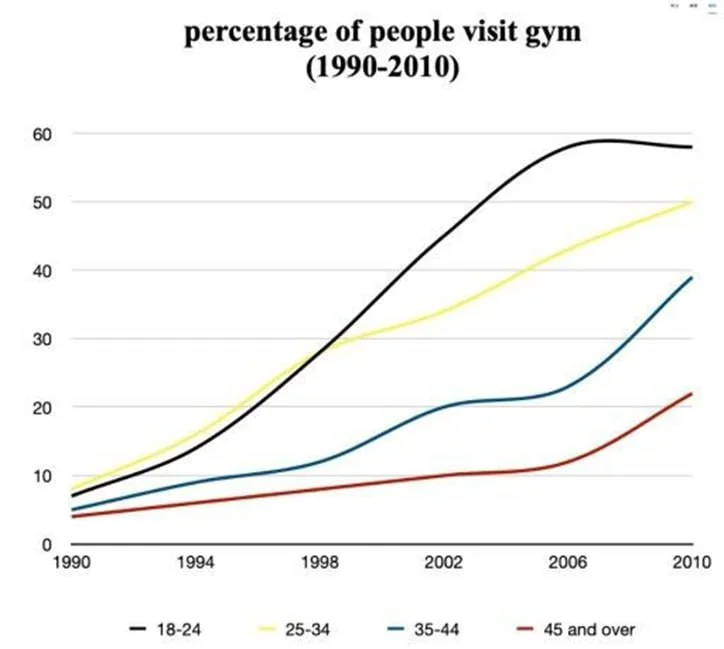
The line graph shows the proportion of people in four age groups, namely 18–24, 25–34, 35–44, and 45+, who did physical activity once or a few times a month from 1990 to two decades later. The data suggest two distinct patterns: the younger groups were more active and experienced sharper increases, while the older cohorts had lower participation rates and more gradual growth.
Regarding the higher-performing groups, the youngest cohort began at roughly 6% and climbed rapidly, reaching almost 60% by 2006 before falling slightly toward the end of the period. The 25–34 group showed a similar overall pattern but started marginally higher, at about 8%. It remained above the youngest group until the late 1990s, reaching around 30% by 1998, after which it continued to grow more steadily and finished at approximately 50% in 2010.
The remaining age groups differed somewhat. Those aged 35–44 rose from just under 7% to nearly 40%, with a noticeable acceleration in the early 2000s. The oldest group increased from around 3% to roughly 20%, representing the slowest but still substantial growth. While both older groups became more active over time, the 35–44 group consistently maintained higher rates and experienced the more pronounced rise.