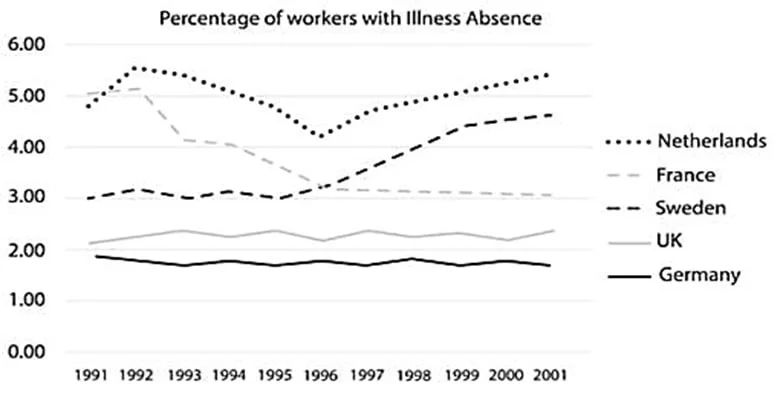
The line graph shows the proportional distribution of employee sick leaves in five countries in Europe between 1991 and 2001. The data suggest the Netherlands and Sweden experienced rising trends in their respective populations, becoming high-range countries, whereas there was a notable decline in France, with the UK and Germany, two low-range countries, showing insignificant changes.
The Netherlands had reached a massive figure of approximately 5.4% by the end, with its rising trend beginning midway through the period, at slightly above 4%. This contrasted sharply with the falling trend in the first half, which began from an all-time high of 5.6% one year after the start of the period. Sweden also showed a similar behavior. Its surge began in the middle of the timeframe, following a period of stability (around 3%), and reached roughly 4.5% one year before the turn of the century, continuing at a slower pace, never reaching 5%.
By contrast, the profile of sick leaves in other countries differed radically. France was the only country where the rate plummeted after one year of showing an increase from 5%, barely reaching 3% and generally remaining at that level for the remainder of the period. The figures in the UK and Germany also differed in that they both began at about 2% and remained relatively stable, although Germany's track record was consistently lower.