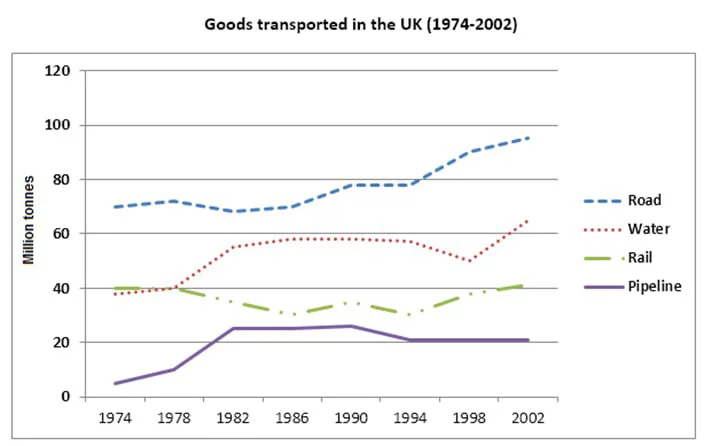
The line graph shows the amounts of goods (in million tons) carried in the UK from 1974 to 2002 via four modes of transport. Overall, except for the rail network showing years of decline, all means of transport witnessed an increase, albeit at various rates, with roads remaining the most dominant and pipelines, the least used means, with the most significant rise.
Most salient was the use of the pipeline network, which roughly quadrupled. Its initial record was barely five million tons, which, after a moderate increase, soared to well over 20 between 78 and 82, a rate that remained unchanged before declining to, and leveling off at, 20 from around 1994 to the end.
Road and maritime routes are the second salient change. Initially, at about 70 million tons (the leading mode), the former rose (not always consistently) to an all-time high of almost 100, although between 90-94, its growth halted. By contrast, the latter did not change in the first four years (about 40) but then soared to almost 60 and plateaued at this rate. Toward the end of the period, this trend experienced an upswing, reaching just above 60 in the last few years.
By contrast, the data behavior for rail was drastically different. Its track record in the first four years was similar to water, but its use dwindled to about 30 for years before regaining its initial record at 40 in the final years.