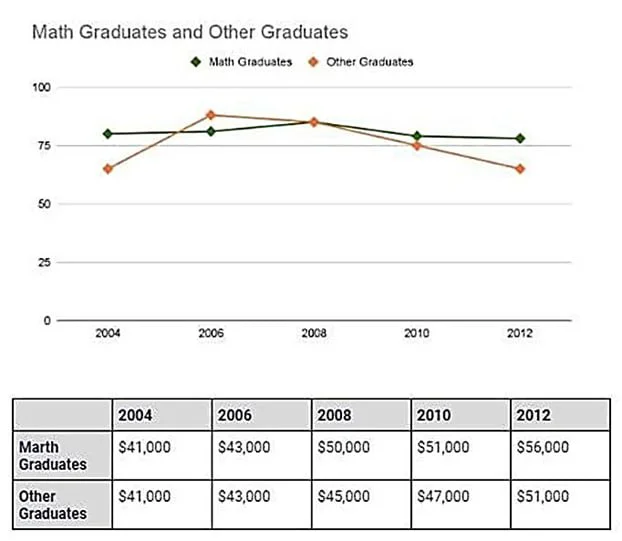
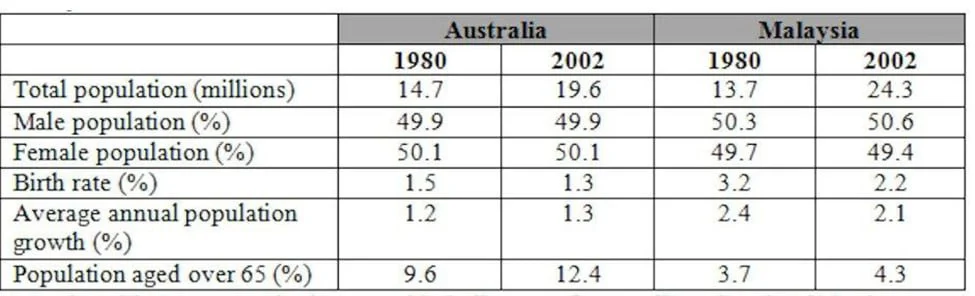
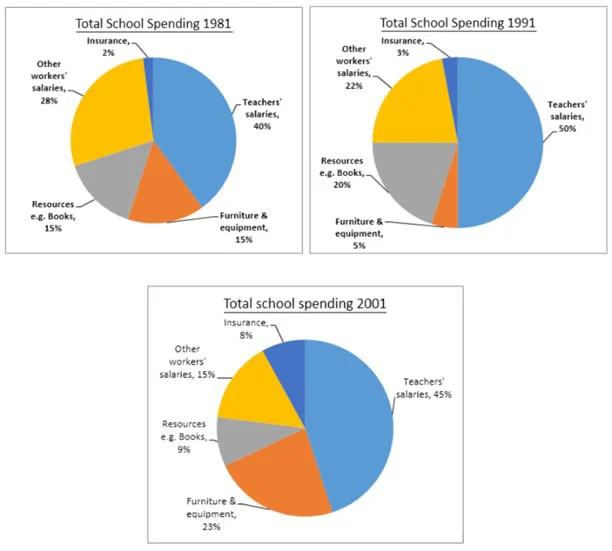
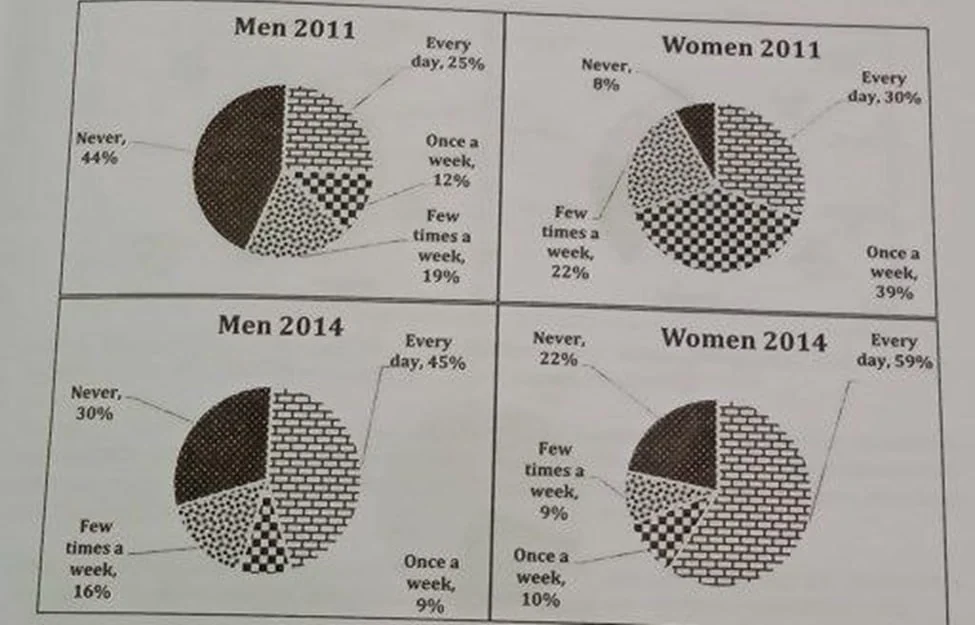
The line graph and the table show the proportions of two groups of graduates (mathematics and others) from an Australian university who were employed full-time, along with their average salaries, between 2004 and 2012. The data suggest that math graduates maintained a consistently higher and more stable employment rate, while the figure for other graduates was more volatile and declined after an initial rise. It is also notable that both groups’ salaries increased steadily, with math graduates pulling further ahead over time.
In terms of employment, the rate for math degree holders fluctuated within a relatively narrow range, between about 76% and 82%, with a modest peak in 2008. This pattern differed from that of other graduates, whose full-time employment rate began at roughly 65%, rose sharply to around 85% in 2006— the only point at which it exceeded the math group—and then fell steadily to return to approximately its starting level by 2012.
Salary trends moved in one direction for both groups. They earned identical amounts in 2004 and 2006, at $41,000 and $43,000, respectively, but math graduates gained a clear advantage thereafter. Their salaries rose to $50,000 in 2008, $51,000 in 2010, and $56,000 in 2012, compared with $45,000, $47,000, and $51,000 for other graduates. This resulted in a widening gap of about $5,000 by the end of the period.