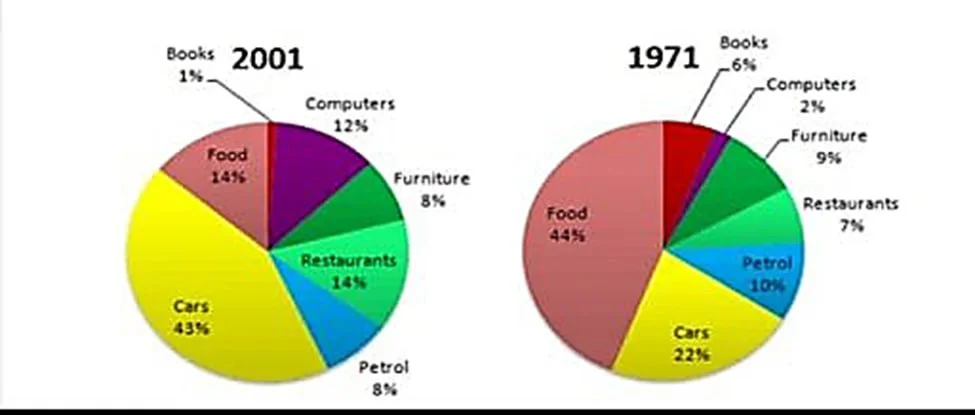
The pie charts show how people in the UK allocated their spending across seven categories in two years: 1971 and three decades later. The data suggest two distinct patterns: some areas—namely food, books, furniture, and petrol—declined to varying degrees, while spending on computers, cars, and restaurants increased at various rates.
Beginning with decreases in expenditure, the figure for food dropped from the largest share in 1971, at 44%, to only 14% of the total. Spending on books showed the next most significant fall, declining from 6% to just 1%, making it the least important category in the new century. By comparison, petrol and furniture experienced only slight reductions, with both falling from around 9–10% to 8%.
In contrast, the spending landscape for the remaining items was vastly different. Car expenditure rose most significantly, increasing from 22%—the second-highest proportion in 1971—to 43%, making it the dominant category. Spending on dining out also doubled, rising from 7%. The most notable change, however, concerns computers, which grew from just 2% to 12%, representing a sixfold increase.