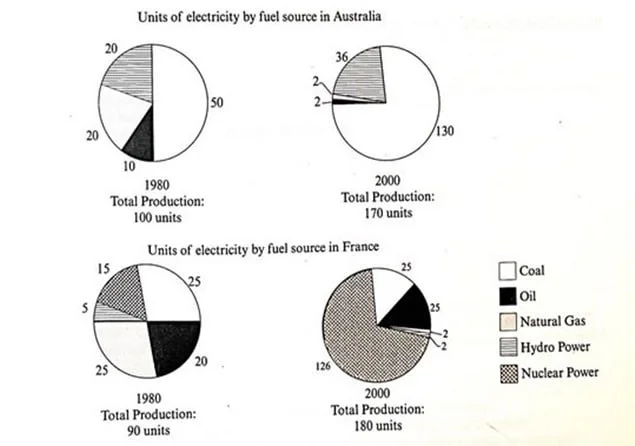
The pie charts show the number of units of electricity produced by five fuel sources in Australia and France in 1980 and two decades later. The data suggest that the total energy production in both countries generally doubled. Moreover, whereas the production landscape in these countries was mainly comprised of fossil fuels, two decades later, France became significantly dependent on green energy.
In Australia, coal produced half the 100 units of electricity in 1980, and twenty years later, when the total production figure nearly doubled, the use of this fuel also increased substantially (130). The total of gas and oil, which first comprised 20 units less than coal, was reduced to almost zero. Hydropower, however, which was notable only in Australia, accounted for 36 units in 2000, nearly twice the figure in 1980.
By contrast, in France, fossil fuels initially covered the lion's share (70/90), a pattern which changed over time as coal and oil were only 50 out of the total 180, and gas fell to a record of almost nothing. On the other hand, green energies played a significant role only in France, the only country with access to nuclear power, whose use rose from a mere 15 and gained dominance over other sources (126 units).