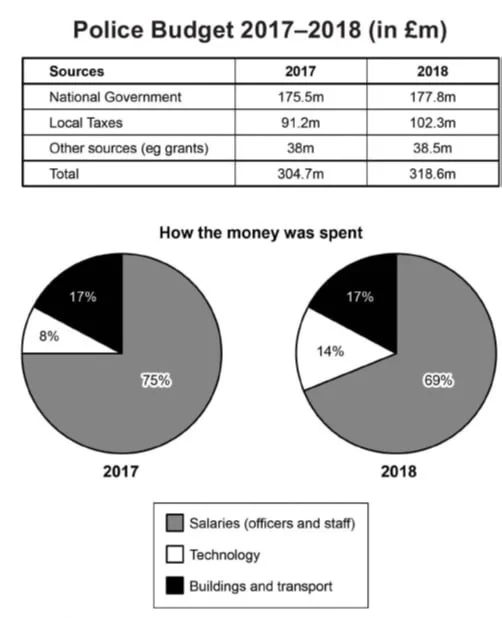
The table and pie charts show the three sources of police funding (in millions of pounds) and their distribution in a region in Britain in 2017 and 2018. The data suggests that all three budget sources of different sizes increased at various rates. Moreover, allocating funds for two of the three listed areas, namely technologies and salaries, also changed patterns.
The total budget was 318.6 million in 2018, an increase of about 13. The most significant contributor to this increase was local tax, which had reached 102.3 – a rise of about 13. The national budget, being the largest part of the total budget (175.5 in 2017), increased only by about 2. The least considerable figure belonged to the unlisted sources, such as grants, which were about 38 and showed a marginal increase.
Regarding spending, technology accounted for a minor fraction (8%) in 2017, nearly doubling (14%), showing the most notable change. By contrast, salaries with the largest proportion (75%) declined by 6%. The ‘facilities and transport’ category was the only spending area remaining unchanged, at 17%.