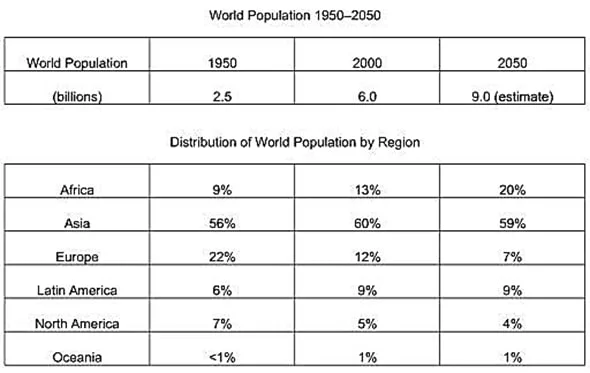
The tables show the change in global population and its proportional distribution across six regions at two points in time: 1950 and 2000, as well as projections for 2050. The data suggests that the increase in the world population will continue uninterrupted. It is also notable that Europe and North America experienced a decline, while the remaining regions showed varying degrees of increase, with estimates suggesting potential ongoing trends or otherwise.
Regarding the decreases, Europe's population, which was about 22% of 2.5 billion in 1950, roughly halved when the world population reached 6 billion 50 years later, and will likely decrease again to about half when the global figure hits 9 billion. North America follows with a steady decline from 7% and is expected to fall to just 4%.
However, the distribution landscape varied greatly among the remaining regions. Asia, with record-high figures, accounted for 56% of the world population before the turn of the century, rising by four percentage points in 2000, and is expected to decrease slightly. This is followed by smaller track records in Africa and Latin America, at 9% and 6%, respectively. After five decades, the former increased a few percentage points and is projected to reach 20%, while the latter reached 9% and is expected to stay the same. Oceania also saw a humble increase to 1%, a record low, and is expected to remain at this level.