
بلاگ
مقالات و اخبار
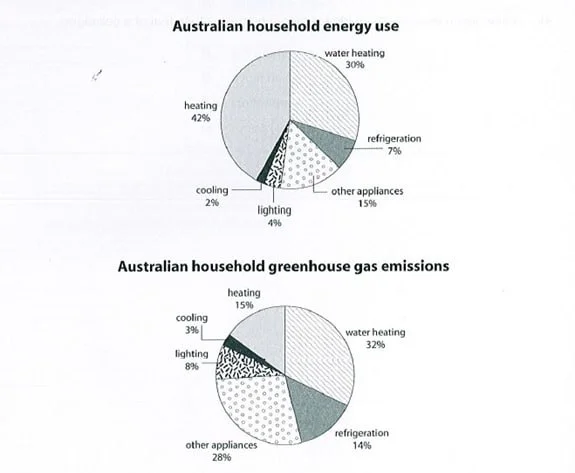
The first chart shows how energy is used in an average Australian household. The second chart shows the greenhouse gas emissions which result from this energy use.
The graphs show the proportions of five main energy uses, as well as a category of unspecified appliances, and their resultant CO2 emissions in an average Australian household. The data suggests that…
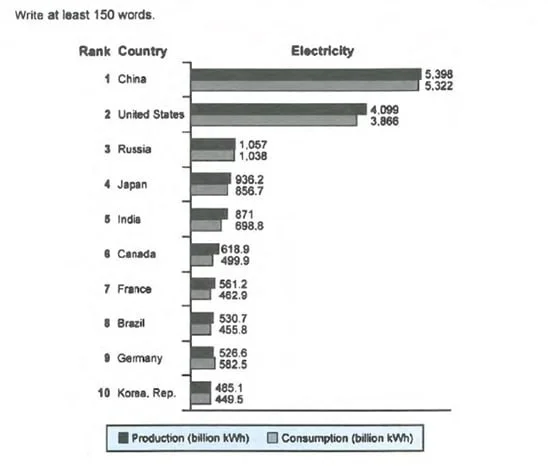
The chart shows the top ten countries for the production and consumption of electricity in 2014.
The chart shows the ten most dominant countries in producing and consuming electricity (in billion kWh) in the year 2014. Overall, two of the listed countries show unrivaled records, followed by three…
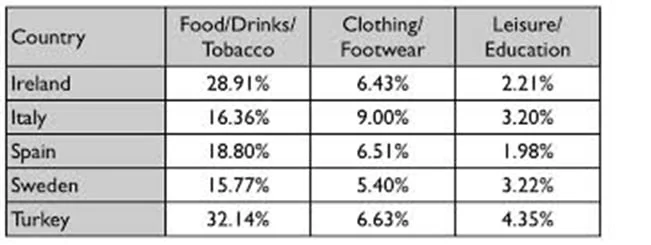
The table gives information on consumer spending on different items in five different countries in 2002.
The table shows the proportions related to consumer expenditure on three sets of items in five countries in the year 2002. Overall, of the three categories, consumer products boast the most marked per…
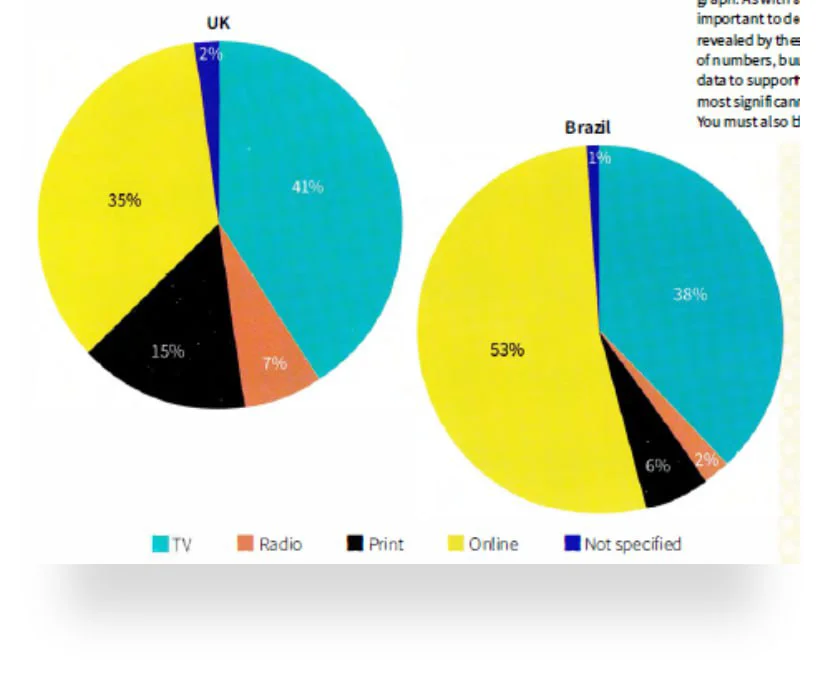
The pie charts show ways of accessing the news in the UK and Brazil.
The pie charts show four main ways (as well as a set of unlisted methods) of finding news in two countries, namely the UK and Brazil. Overall, TV and online channels are the most dominant methods in b…
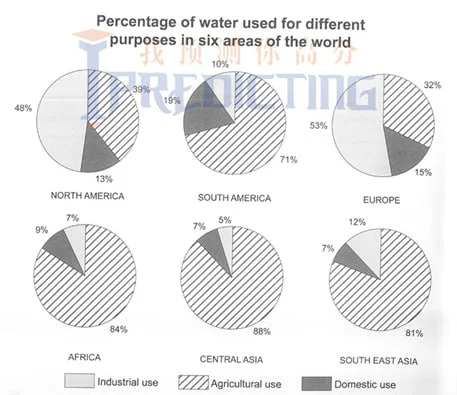
The charts below show the percentage of water used for different purposes in six areas of the world.
The pie charts show the proportional water distribution for three uses in six parts of the world. Overall, while four of the areas share broad similarities in the massive use of water for agriculture,…
