
بلاگ
مقالات و اخبار
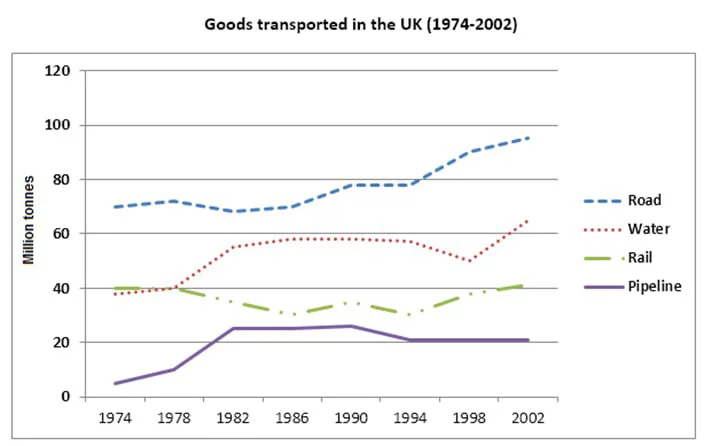
The graph below shows the quantities of goods transported in the UK between 1974 and 2002 by four modes of transport.
The line graph shows the amounts of goods (in million tons) carried in the UK from 1974 to 2002 via four modes of transport. Overall, except for the rail network showing years of decline, all means of…
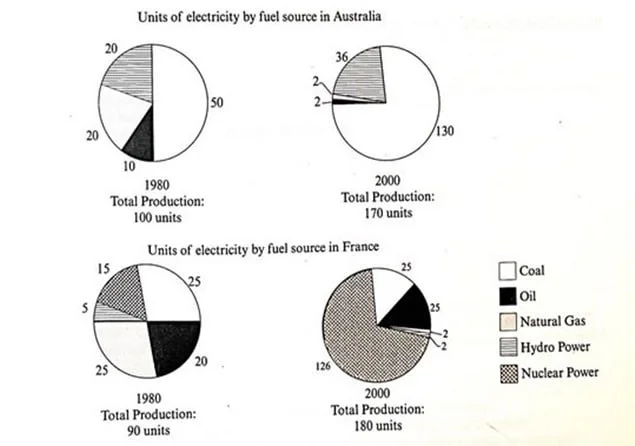
The pie charts show units of electricity by fuel source in Australia and France in 1980 and 2000.
The pie charts show the number of units of electricity produced by five fuel sources in Australia and France in 1980 and two decades later. The data suggest that the total energy production in both co…
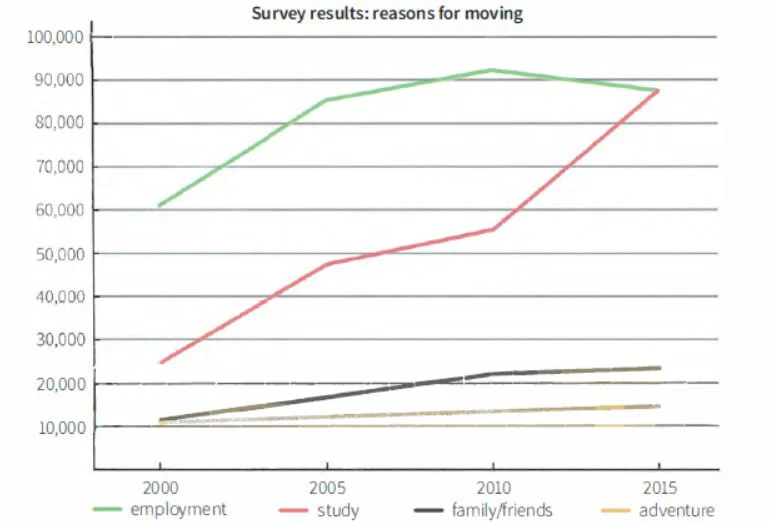
The line graph gives information about the results of a survey on the main reasons people moved to the capital of a particular country.
The graph shows four key motivations for relocating to the capital of a specific country between 2000 and 2015. Overall, moving for education showed the sharpest and most significant increase, followe…
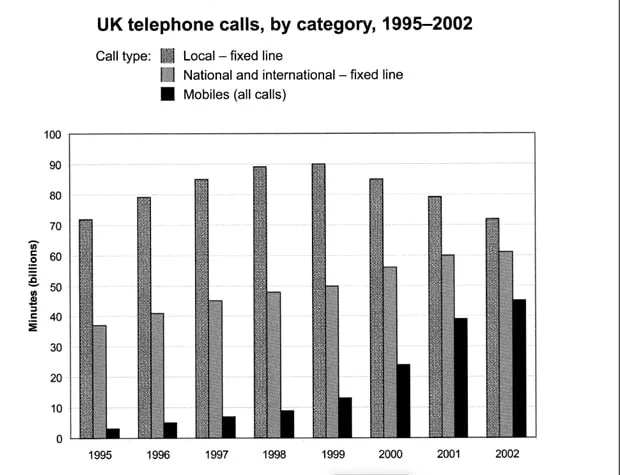
The chart shows the total number of minutes (in billions) of telephone calls in the UK, divided into three categories from 1995 to 2002.
The graph shows call durations (in billions of minutes) in three categories in the UK between 1995 and 2002. The data suggests that mobile calls experienced the most significant increase despite remai…
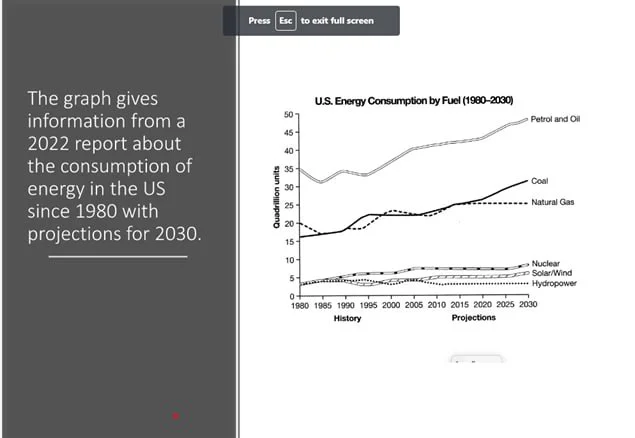
The graph shows the consumption of fossil and green energies (from a 2022 report) in the US (in quadrillion units) since 1980, with predictions for 2030.
Overall, fossil fuels have been most prevalent, with similar projections for the future, with petrol and oil topping the list. Alternative energy sources, however, rank at the bottom with substantiall…
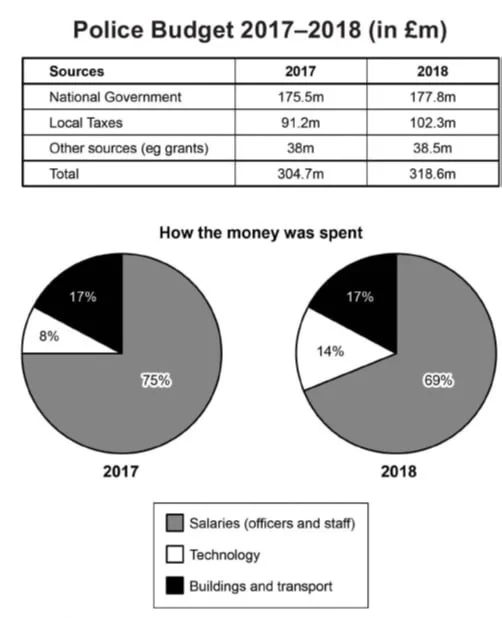
The table and chart give information on the police budget for 2017 and 2018 in one area of Britain. The table shows where the money came from, and the charts show how it was distributed.
The table and pie charts show the three sources of police funding (in millions of pounds) and their distribution in a region in Britain in 2017 and 2018. The data suggests that all three budget source…
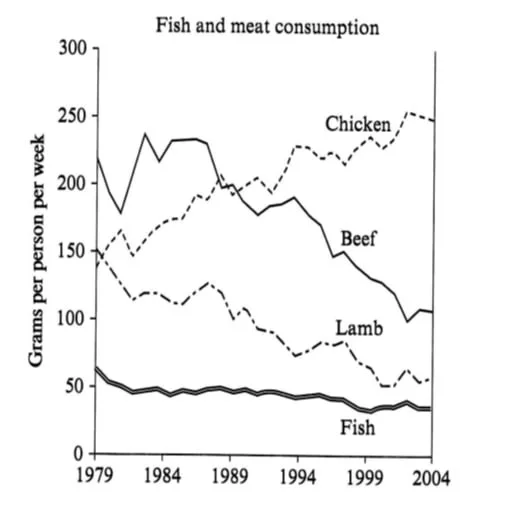
The graph shows the consumption of fish and some different kinds of meat in a European country between 1979 and 2004.
The line graph shows the quantity of four types of meat fish, lamb, beef, and chicken (measured in grams per person per week) in a country in Europe from 1979 to 2004. The data suggest that while the…
