
بلاگ
مقالات و اخبار
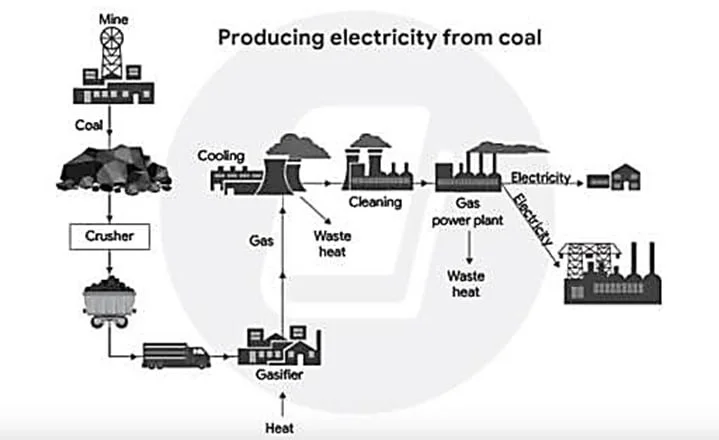
The diagram shows how one type of coal is used to produce electricity.
The diagram shows the linear process through which one type of coal is transformed into electricity. Overall, the system combines natural resources with engineering-based operations, moving coal throu…
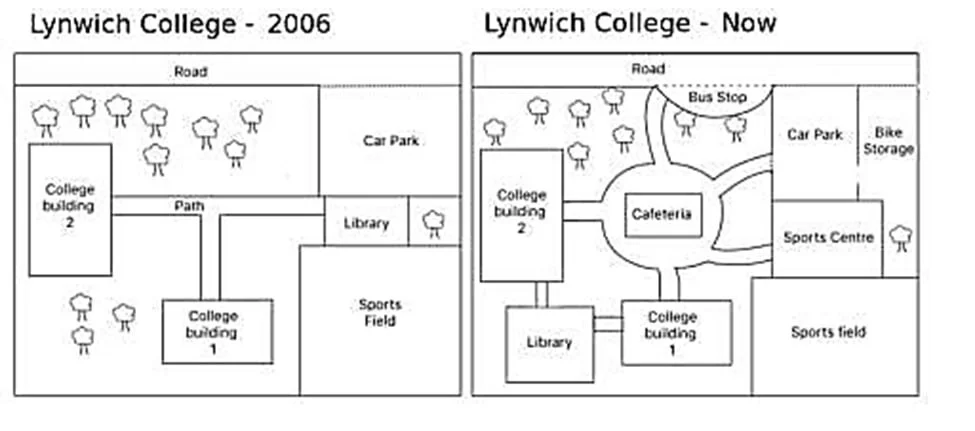
The plans show the site of a college in 2006 and the present day.
The two plans compare the configuration of a college in 2006 with its current state. The data suggest that the college has evolved from a simple layout offering limited amenities to a multifunctional…
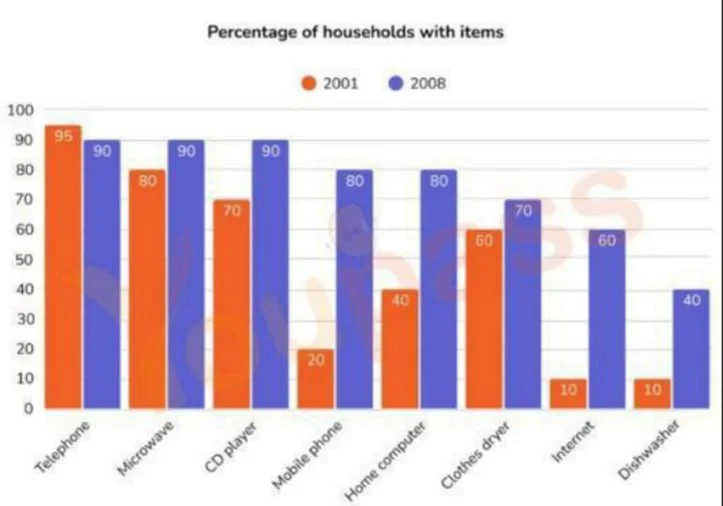
The graph shows the percentage of households in one country that had various goods between 2001 and 2008.
The bar chart shows the proportion of households that owned a range of home appliances and home technologies in a country in 2001 and 2008. Overall, ownership increased for every item except telephone…
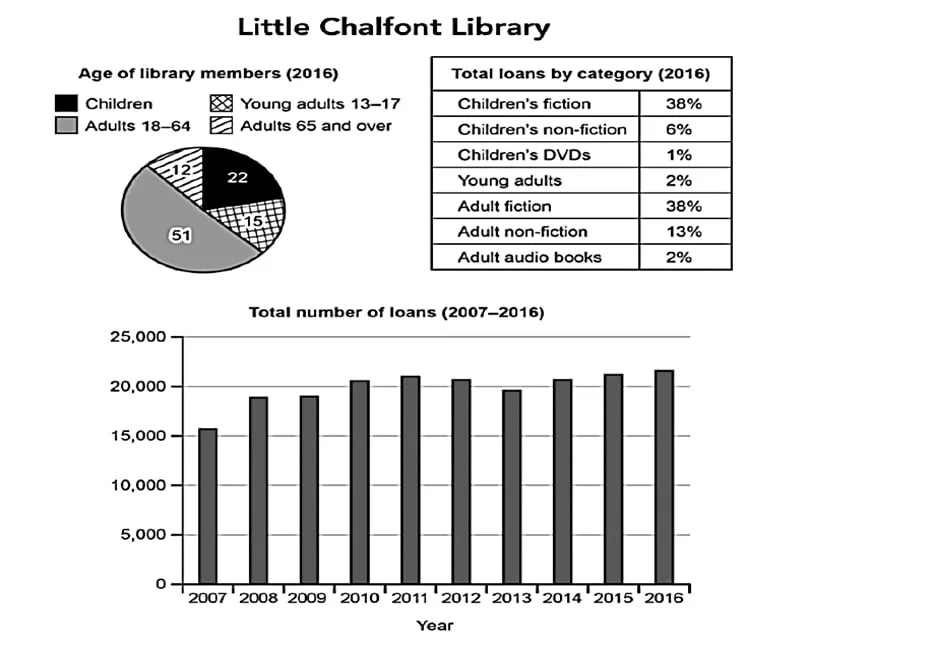
The charts below give information about a public library in a town called Little Chalfont.
The pie chart and the table show the proportional distribution of library members across four age groups and the breakdown of loans across seven categories in Little Chalfont. The bar chart shows the…
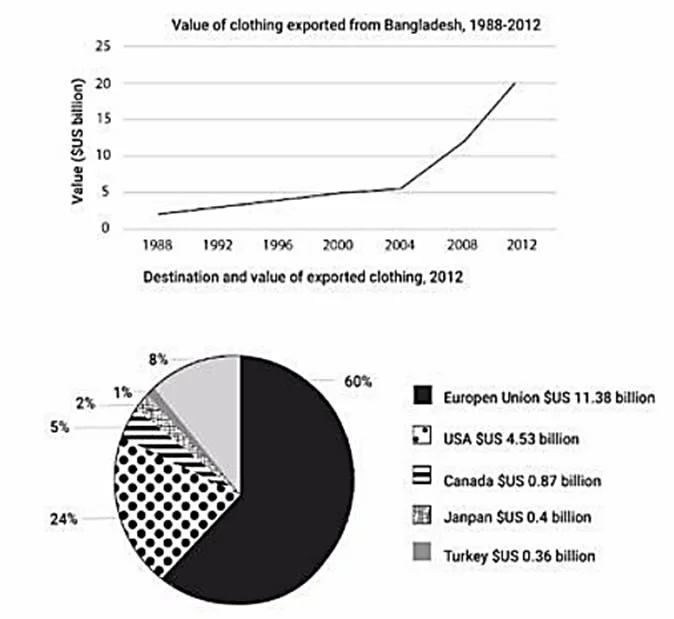
The graph shows the value of clothing exported from Bangladesh between 1998 and 2012, and the chart shows the destinations and value of exported clothing in 2012.
The line graph shows the value of Bangladesh s clothing exports from 1998 to 2012, while the pie chart compares the distribution of these exports across five markets in 2012. The figures indicate that…
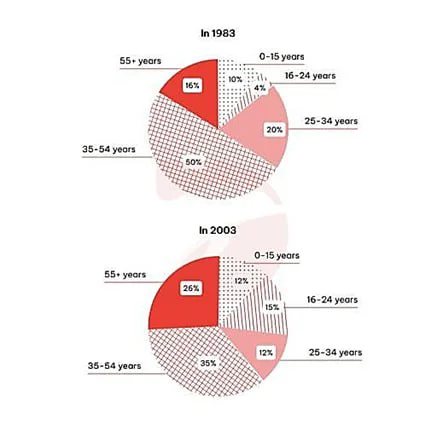
The charts give information about the age of visitors from the UK to Spain in 1983 and in 2003.
The pie charts show the proportional distribution of UK visitors to Spain across five age groups in 1983 and 2003. While neither chart indicates a linear correlation between age and travel rates, the…
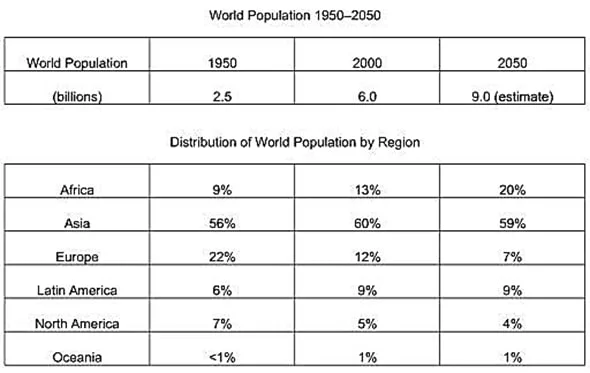
The tables below give information about the world population and distribution in 1950 and 2000, with an estimate of the situation in 2050.
The tables show the change in global population and its proportional distribution across six regions at two points in time: 1950 and 2000, as well as projections for 2050. The data suggests that the i…
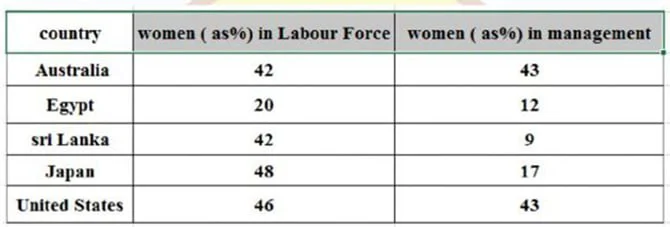
The table below shows the proportions of women in the labor force and in management across five countries.
The table shows the representation of females in the labor force and managerial positions across five nations. The data suggest that while the rates for the Australian and American female workers and…
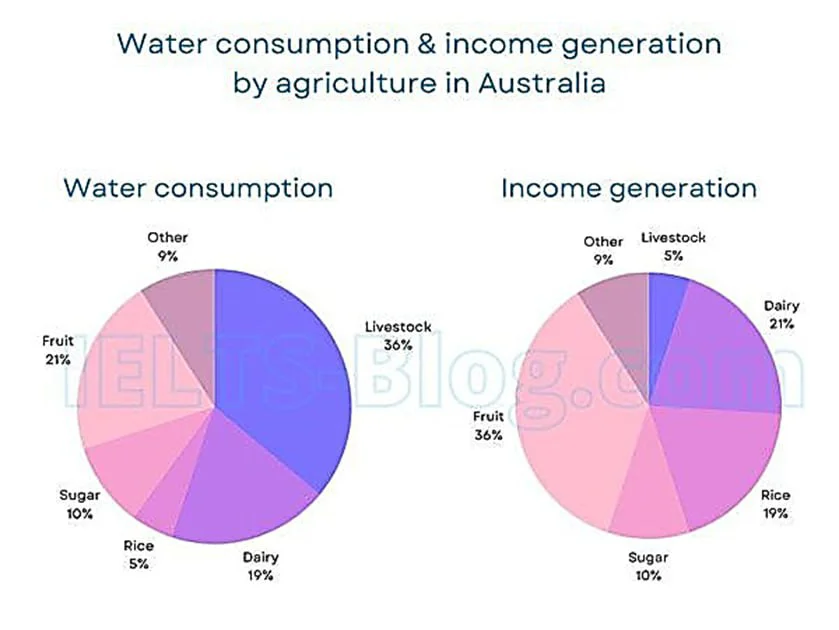
The charts below give information on the consumption of water by agricultural products in Australia in 2014, and the share of income they produced.
The pie charts show the percentage of water use for cultivating five agricultural products livestock, dairy, rice, sugar, and fruit and an unnamed category, along with the proportion of revenue these…
