
بلاگ
مقالات و اخبار
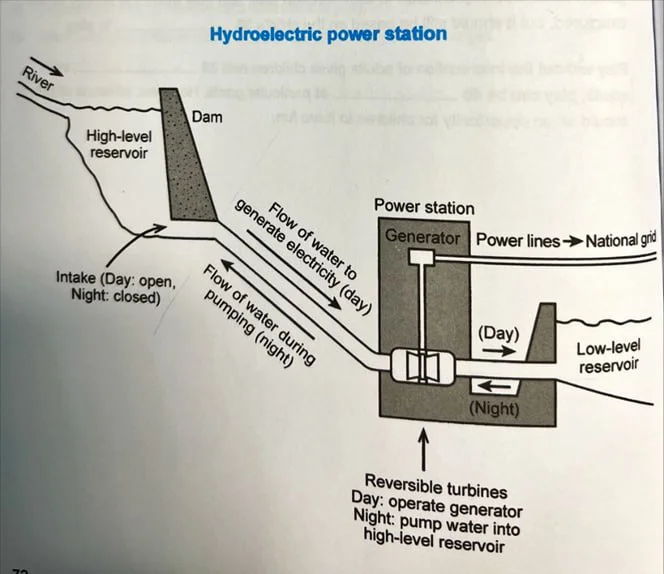
The diagram shows how electricity is generated in a hydroelectric power station.
The diagram shows how a hydroelectric power station generates electricity. Overall, this operation combines nature and engineering, and electricity is produced through two distinct yet harmonious proc…
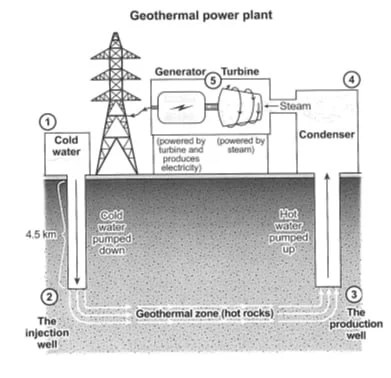
The diagram shows how geothermal energy is used to produce electricity.
The diagram shows how geothermal energy is harnessed for electricity production in a power plant. Overall, this linear process combines engineering and natural resources and involves five steps to hea…
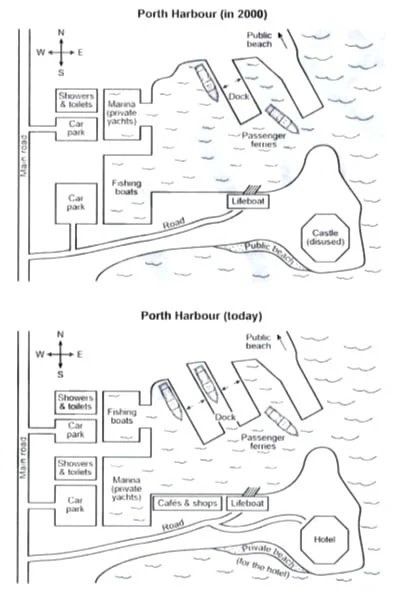
The plans show a harbor in 2000 and how it looks today.
The plans show Porth Harbor in 2000 and the changes made to it today. Overall, the sea-related services changed or expanded, and a more comprehensive range of amenities is offered to provide visitors…
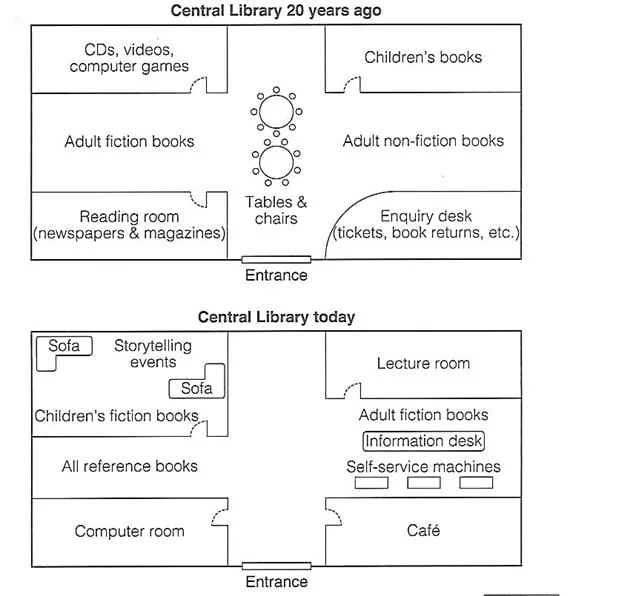
The diagram shows the floor plan of a public library 20 years ago and how it looks now.
The maps show the layout of a public library two decades ago and its transformed version today. Overall, this facility has adopted an open space design with more suitable services, ranging from specif…
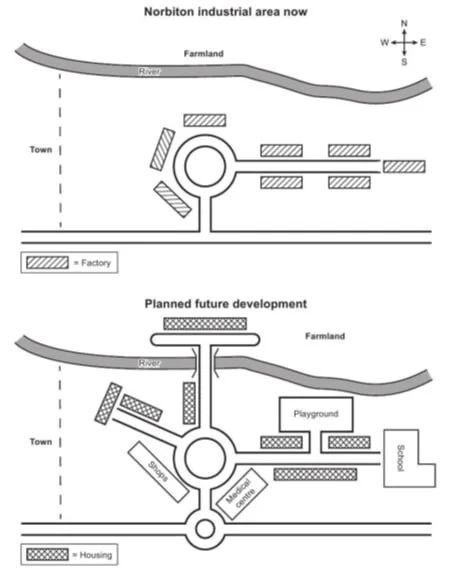
The maps show an industrial area in the town of Norbiton and planned future development for the site.
The maps show Norbiton s industrial area and its future development. Overall, this industrial zone will be converted into a more expanded residential area, with its current road layout significantly a…
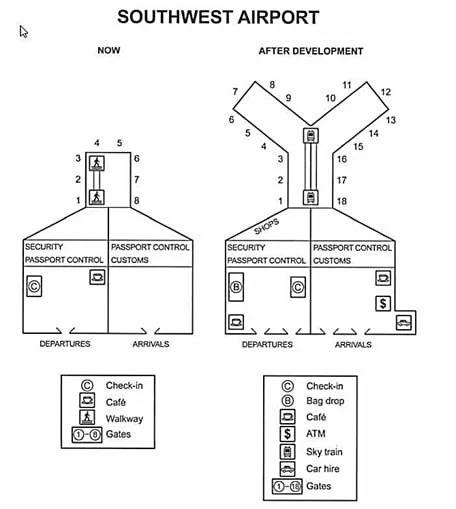
The plans below show the site of an airport now and how it will look after redevelopment next year.
The plans show Southwest Airport in its current shape and its redeveloped version in the future. Overall, the airport is expected to offer a broader range of facilities, particularly in the concourse…
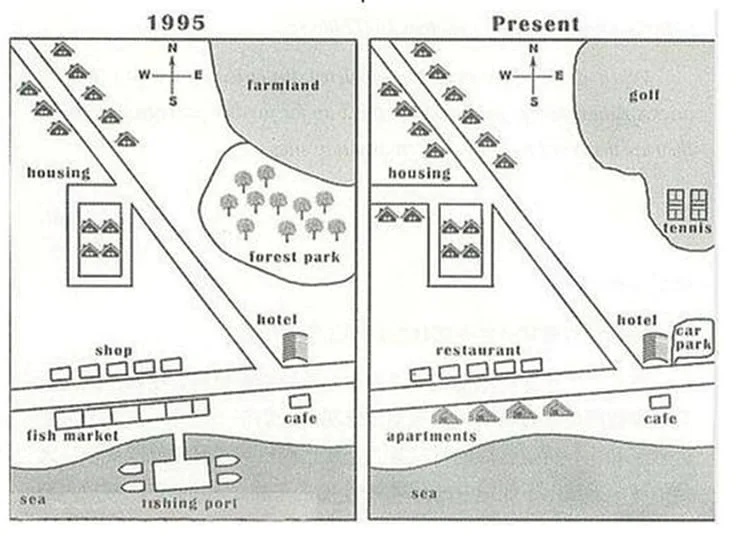
The map below shows the development of the village of Ryemouth between 1995 and present.
The maps show how Ryemouth village has evolved since 1995. Overall, this fishing village has transformed into a more modern area, accommodating more residents and providing a broader array of services…
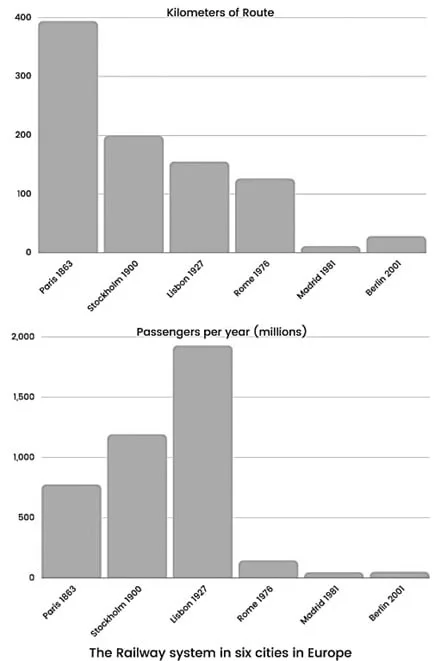
The bar charts below give information about the railway system and the dates they opened in six cities in Europe.
The bar charts show the subway systems in six European metropolises based on opening date, length (kilometers), and passengers (millions). The data suggest that the railways span positively correlates…
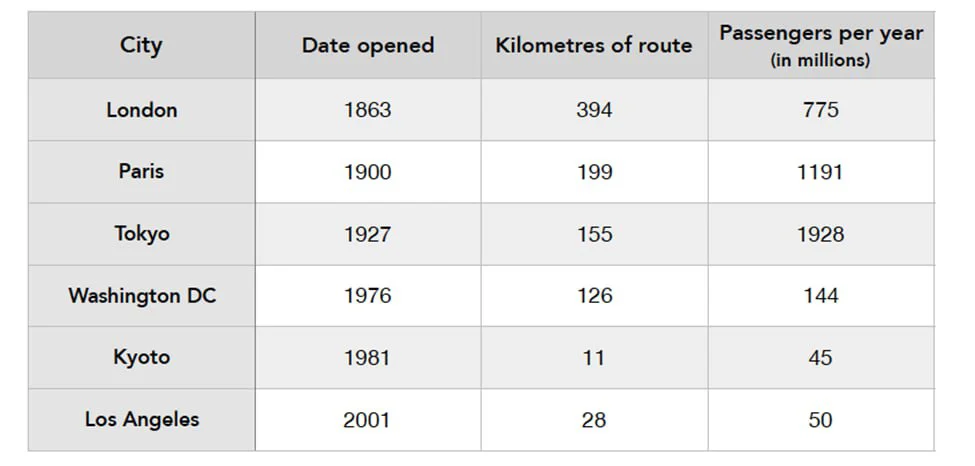
The table shows data about underground railway systems in six major cities with the date they opened, kilometers of route, and passenger numbers per year in millions.
The table shows the underground railway systems in six metropolises by opening date, length (km), and passengers (in millions) carried annually. The data suggest that a general positive correlation ex…
