
بلاگ
مقالات و اخبار
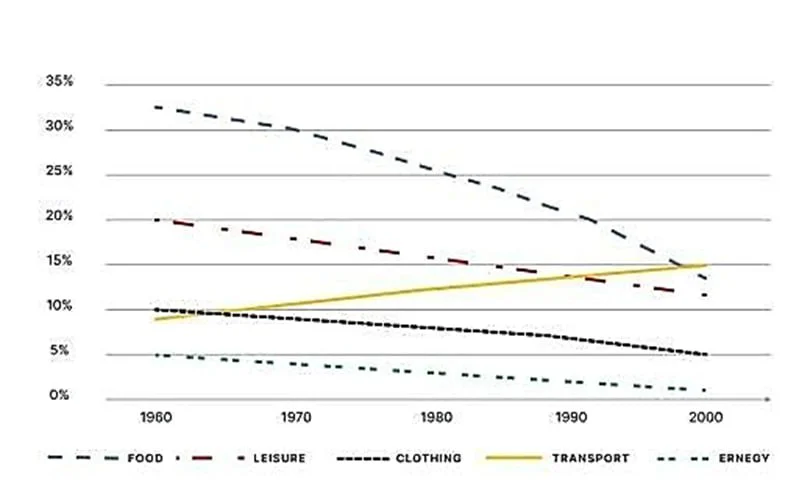
The graph shows the percentage of spending in a European country from 1960 to 2000.
The graph shows the percentage of spending in a European country from 1960 to 2000. The line graph shows the proportion of money spent on five categories of items in a country in Europe between 1960 a…
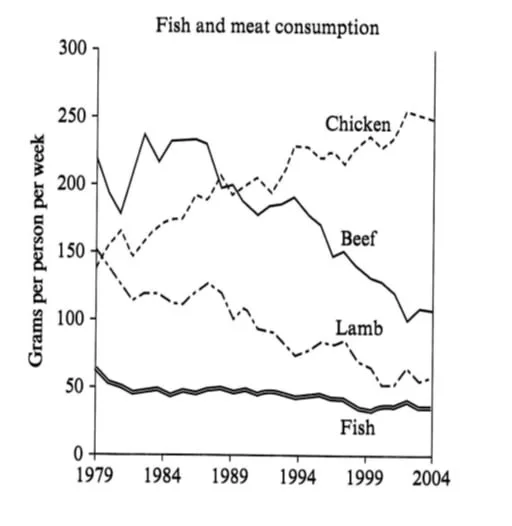
The graph shows the consumption of fish and some different kinds of meat in a European country between 1979 and 2004.
The graph shows the consumption of fish and some different kinds of meat in a European country between 1979 and 2004. The line graph shows the quantity of four types of meat fish, lamb, beef, and chic…
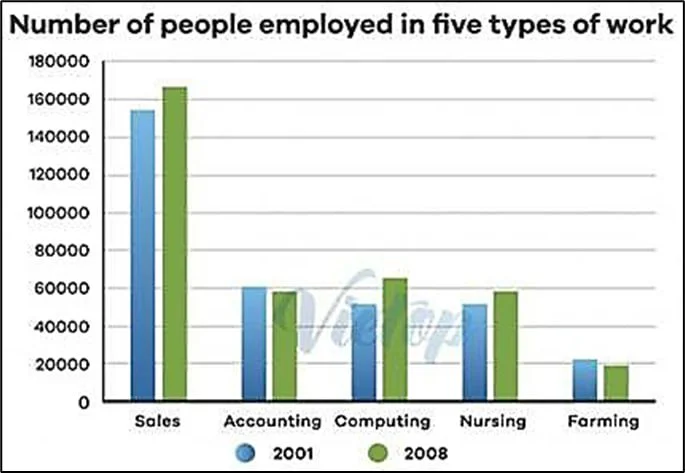
The chart shows the number of people employed in five types of work in a certain region in Australia in 2001 and 2008.
The chart shows the number of people employed in five types of work in a certain region in Australia in 2001 and 2008. The bar chart shows employment rates across five career types in an area of Austr…
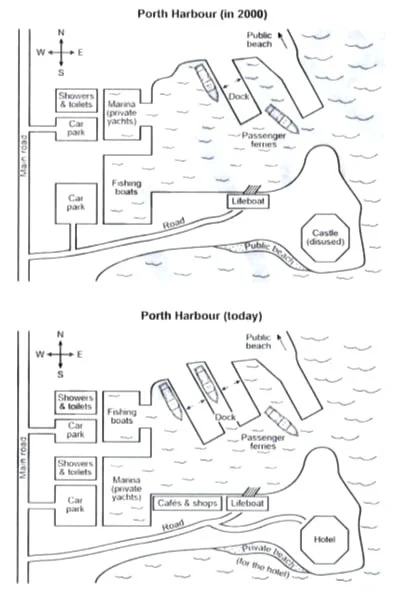
The plans show a harbor in 2000 and how it looks today.
The plans show a harbor in 2000 and how it looks today. The plans show Porth Harbor in 2000 and the changes made to it today. Overall, the sea-related services changed or expanded, and a more comprehe…
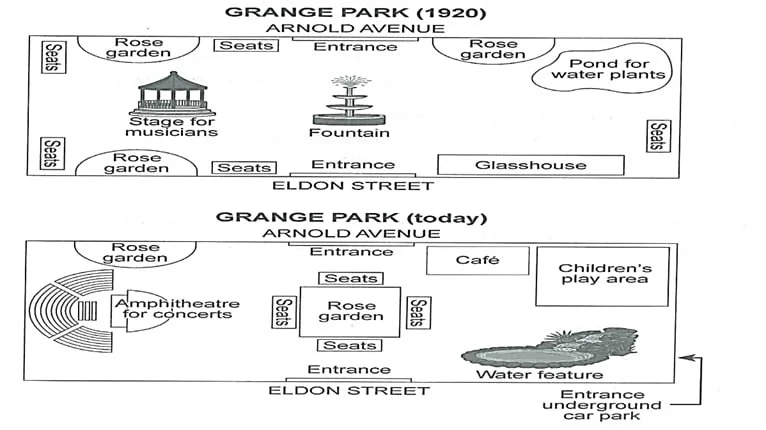
The plans below show a public park when it first opened in 1920 and the same park today.
The plans below show a public park when it first opened in 1920 and the same park today. Cambridge 14 test 4 The plans show a public park called Grange Park in its early days in 1920 and its current s…
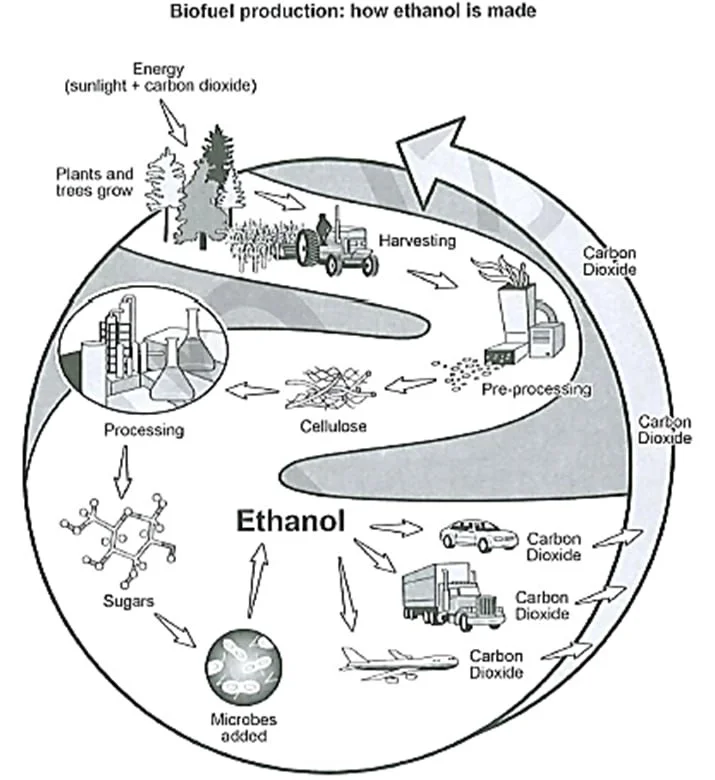
The diagram below shows how a biofuel called ethanol is produced.
The diagram below shows how a biofuel called ethanol is produced. The diagram shows how ethanol, a type of biofuel, is produced. Overall, in this cyclic process, carbon dioxide, involved both at the s…
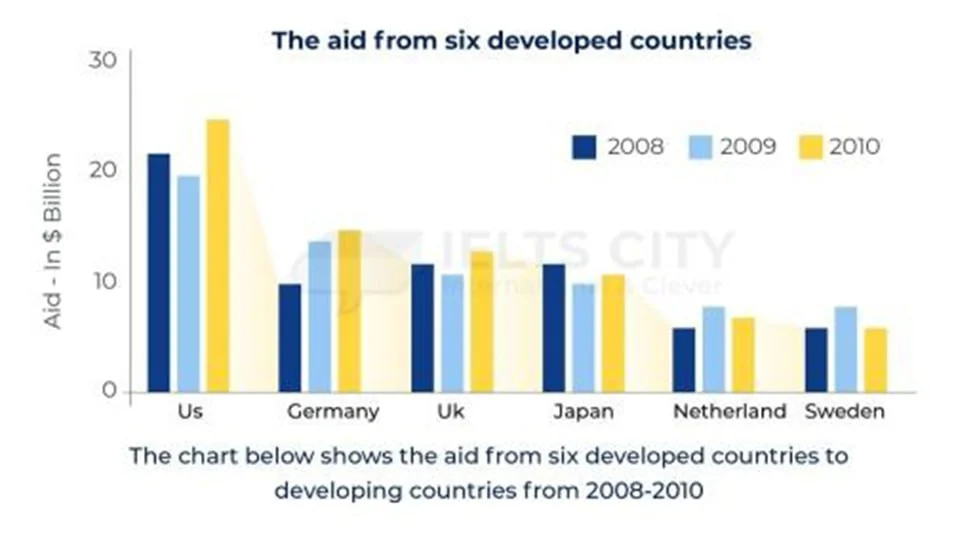
The chart below shows the aid from six developed countries to developing countries from 2008 to 2010.
The chart below shows the aid from six developed countries to developing countries from 2008 to 2010. این سوال ترکیب دو نوع اصلی از سوال تسک 1 هست: گزارش شباهت ها و تفاوت ها گزارش تغییرات در طول زمان…
Type of prompts in Task 1
Type of prompts in Task 1 Reporting similarities and differences: static data no change size (figures or percentages) Comparison and contrast Reporting changes over time Continuous time period Size (f…
Here is a list of comparative structures that can be used in both Tasks 1 and 2 of IELTS writing.
Here is a list of comparative structures that can be used in both Tasks 1 and 2 of IELTS writing. 1. Basic Comparatives - Expensive clothes are usually more durable than cheap clothes. - In 2020, Germ…
