
بلاگ
مقالات و اخبار
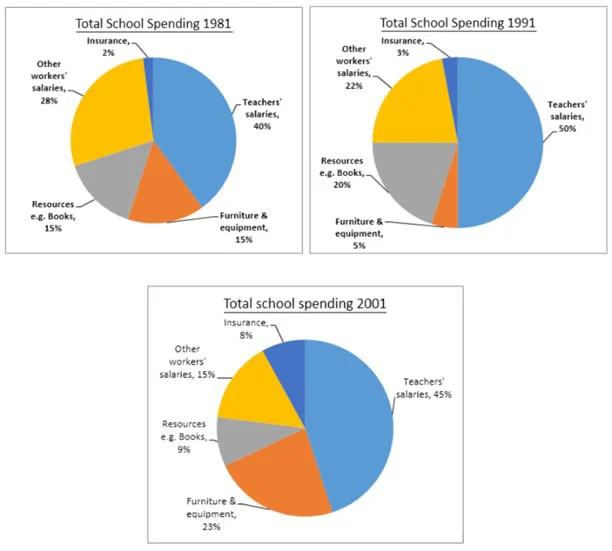
The three pie charts show the changes in the annual spending by a particular UK school in 1981, 1991, and 2001.
The pie charts show the proportional distribution of a school's total spending in the UK across five categories for the years 1981, 1991, and 2001. The data suggest that salaries for teachers and…
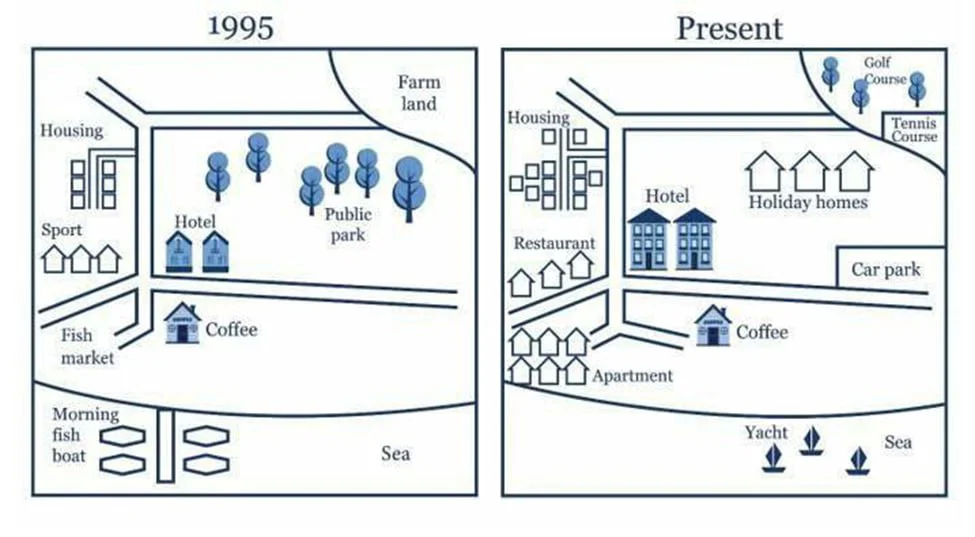
The maps show changes in a city from 1950 to the present.
The maps compare the layout of a coastal city in 1950 with its present configuration. The changes indicate a clear transformation from a small, locally focused settlement into a tourism-oriented urban…
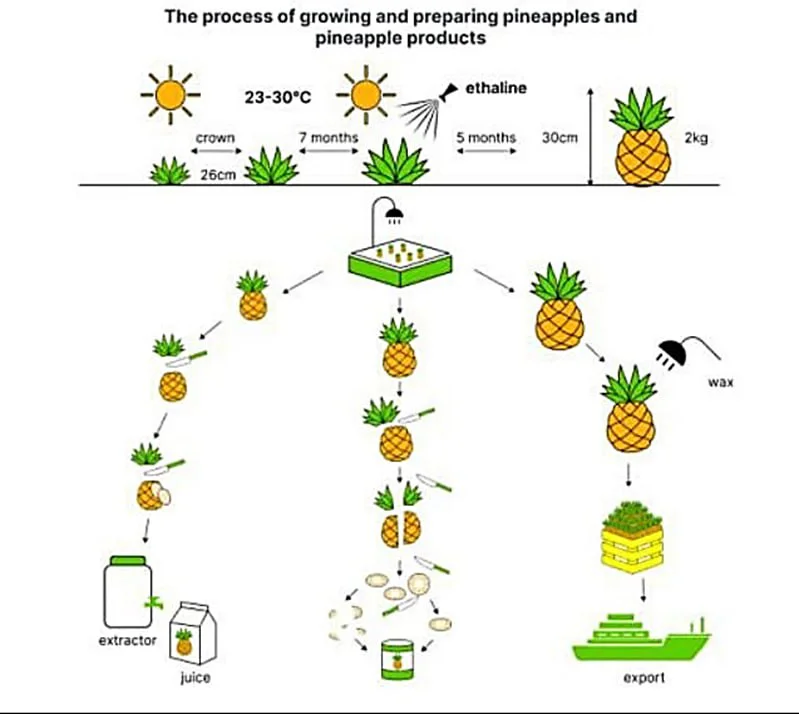
The diagram below shows the process of growing and preparing pineapples and pineapple products.
The diagram shows the process of cultivating pineapples and preparing them for different end products. The process consists of two main stages: the agricultural growth of the fruit under controlled co…
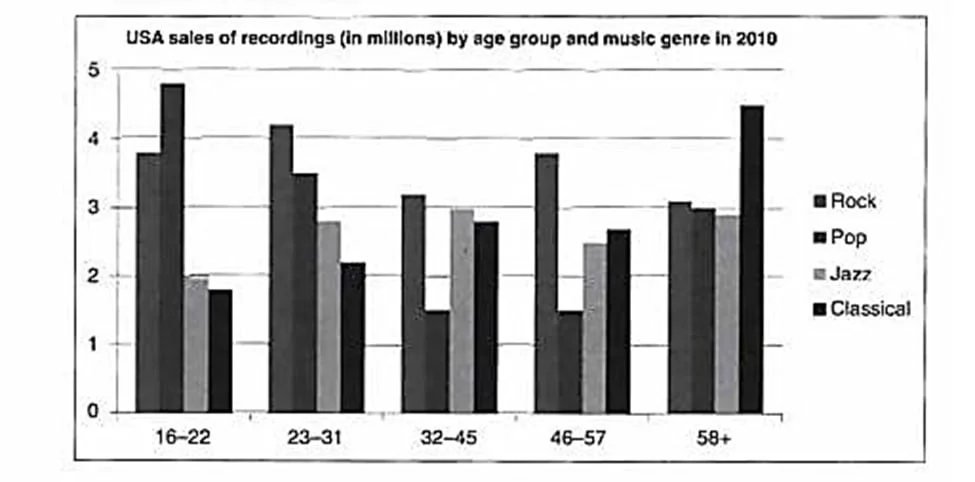
The chart below shows the types of music bought in the US in 2010 by age group.
The bar chart compares the sales of four music genres (in millions) among five age groups in the United States in 2010. The data suggest that Pop and Rock tended to attract younger buyers, while Jazz…
Here is a list of comparative structures that can be used in both Tasks 1 and 2 of IELTS writing.
1. Basic Comparatives - Expensive clothes are usually more durable than cheap clothes. - In 2020, Germany's exports were higher than France's. 2. Using as as for Equal Comparisons - Cheap clot…
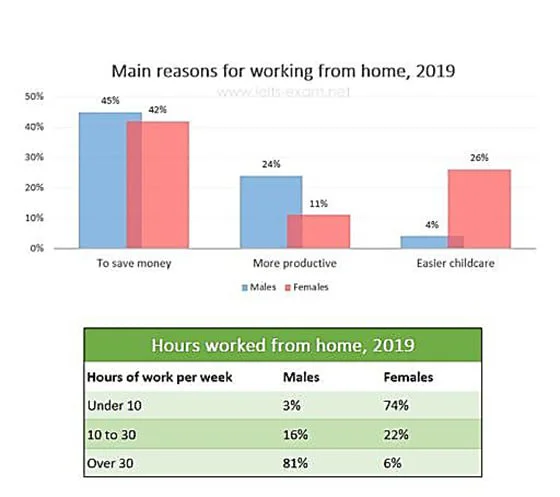
The chart and the table show the main reasons workers chose to work from home and the hours males and females worked from home in 2019.
The bar chart and table compare the main motivations for working from home among men and women in 2019 together with the weekly hours they worked remotely. The data suggest a clear gender contrast: me…
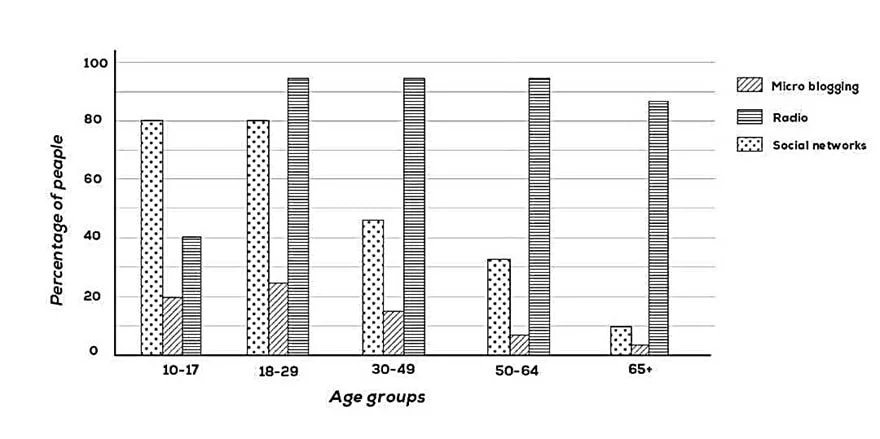
The chart shows the types of media that people of different age groups used to get daily news from in one country in 2011.
The bar chart shows how people of five age groups obtained their daily news in a country in the year 2011. The data suggest that reliance on social networking and microblogging to access news declined…
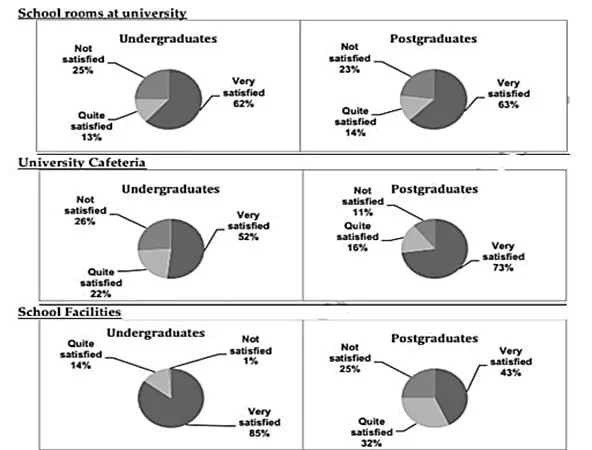
The charts provide information about students in 2007 who were happy with different facilities at a university in the UK.
The pie charts show the satisfaction levels of undergraduate and postgraduate students with different aspects of a UK university in 2007. The data suggest that although satisfaction was generally high…
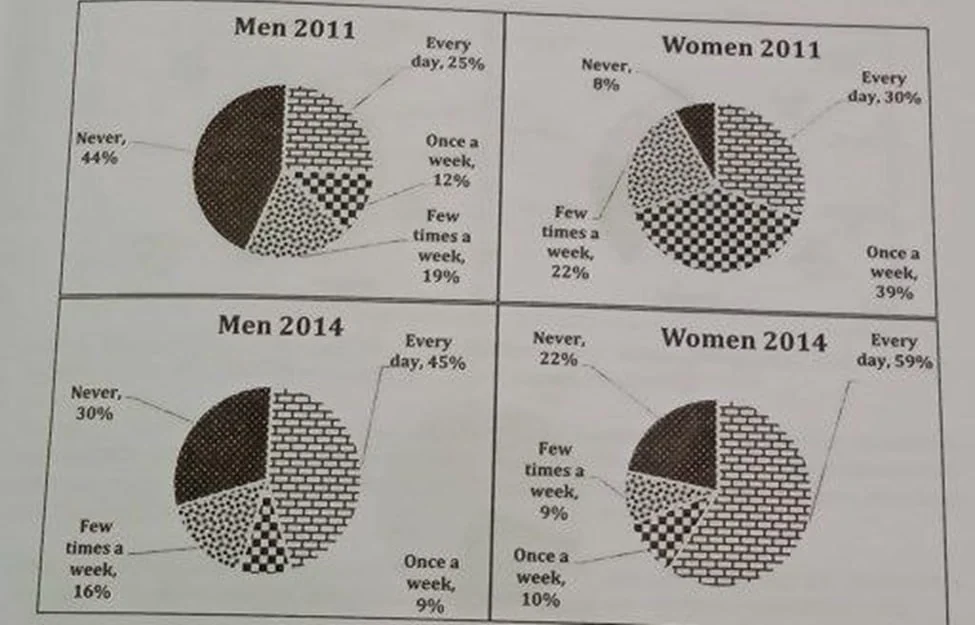
The charts show the use of social media by men and women in Australia in 2011 and 2014.
The pie charts compare how men and women in Australia used social media in 2011 and 2014. The data suggest a nationwide shift toward daily usage for both genders and a collapse in mid-frequency engage…
