
بلاگ
مقالات و اخبار
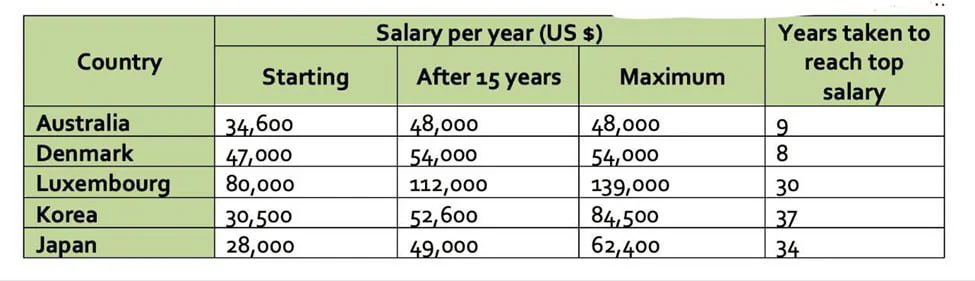
The table gives information about the salaries of secondary teachers in different countries.
The table presents information on starting salaries, earnings after 15 years, and maximum salaries for secondary teachers in five countries in 2009, together with the number of years required to reach…
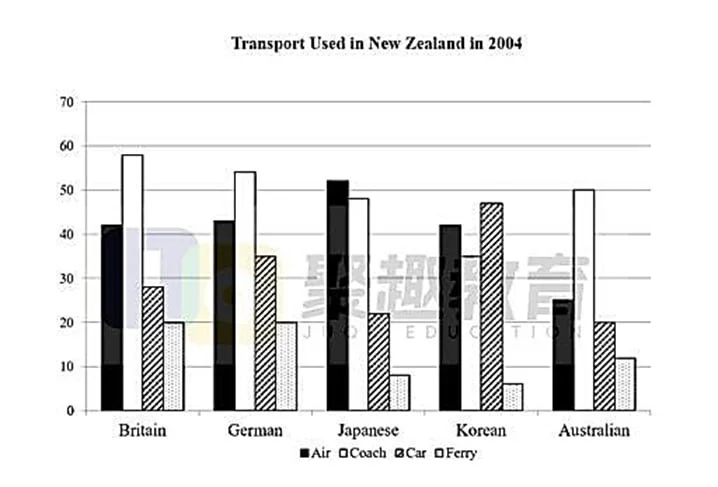
The graph shows the types of transport used by tourists who visited New Zealand from five countries in 2004.
The bar chart shows four kinds of transportation air, coach, car, and ferry and the frequency of their use by tourists from five nations in 2004. The data suggest two broad patterns: visitors from Bri…
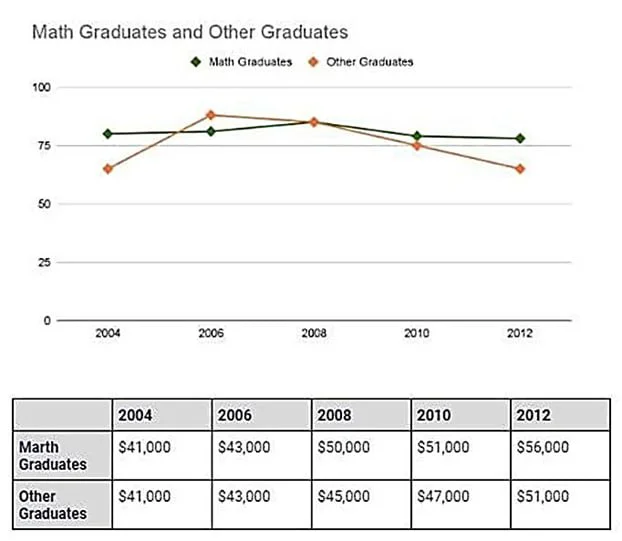
The graphs below show the percentage of graduates who found full-time jobs after graduation from a university in Australia and the average salary of these graduates, from 2004 to 2012.
The line graph and the table show the proportions of two groups of graduates (mathematics and others) from an Australian university who were employed full-time, along with their average salaries, betw…
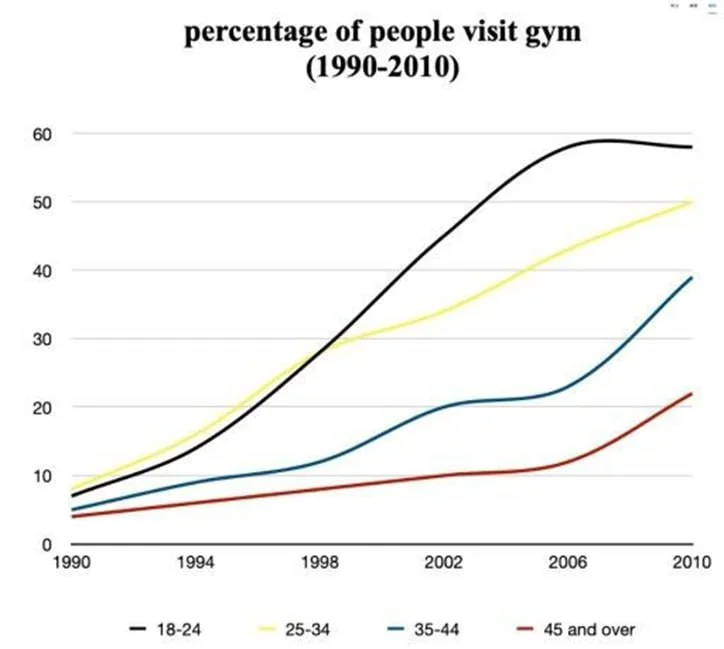
The graph below shows the percentage of people visiting the gym once a month or more between 1990 and 2010.
The line graph shows the proportion of people in four age groups, namely 18 24, 25 34, 35 44, and 45+, who did physical activity once or a few times a month from 1990 to two decades later. The data su…
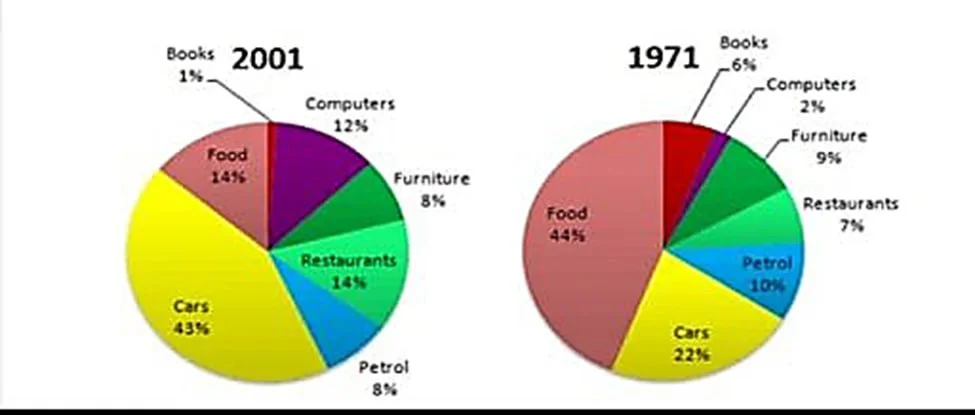
The graphs show changes in the spending habits of people in the UK between 1971 and 2001.
The pie charts show how people in the UK allocated their spending across seven categories in two years: 1971 and three decades later. The data suggest two distinct patterns: some areas namely food, bo…
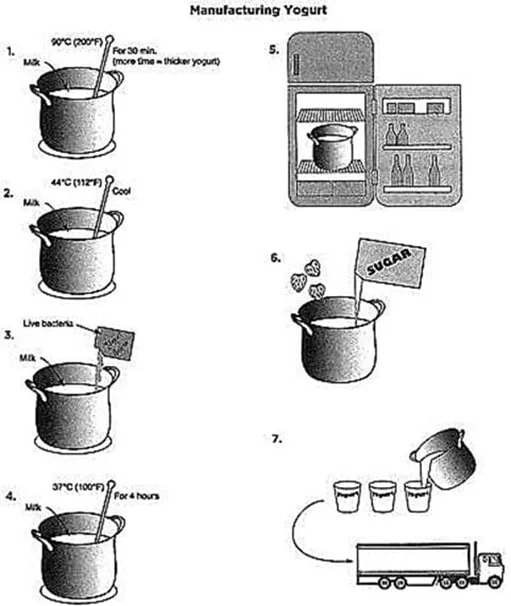
The diagram below shows the process of yogurt making.
The diagram shows a seven-step linear process for producing yogurt from milk. Overall, the procedure consists of two main phases: an initial thermal conditioning of the milk, followed by the biologica…
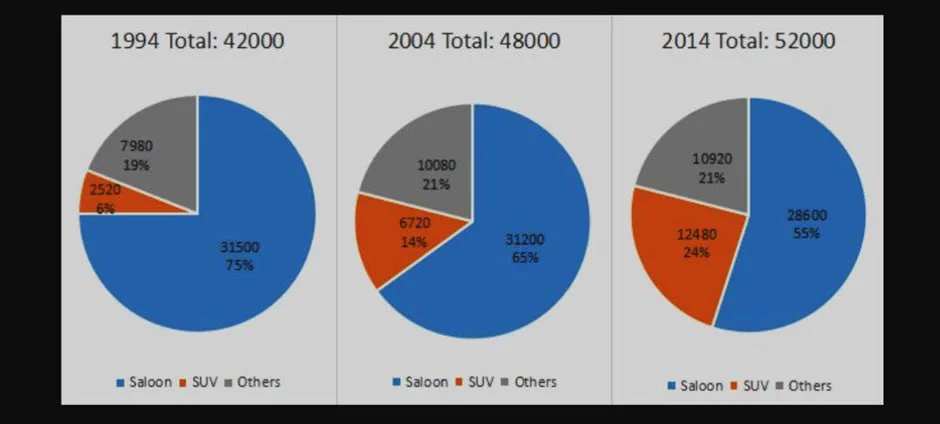
The charts show the number and percentage of the sales of new cars in Australia in April 1994, 2004, and 2014.
The pie charts show changes in the number and sales distribution of saloons, SUVs, and other unspecified car types in Australia in April over three years: 1994, 2004, and 2014. The data reflect an inc…
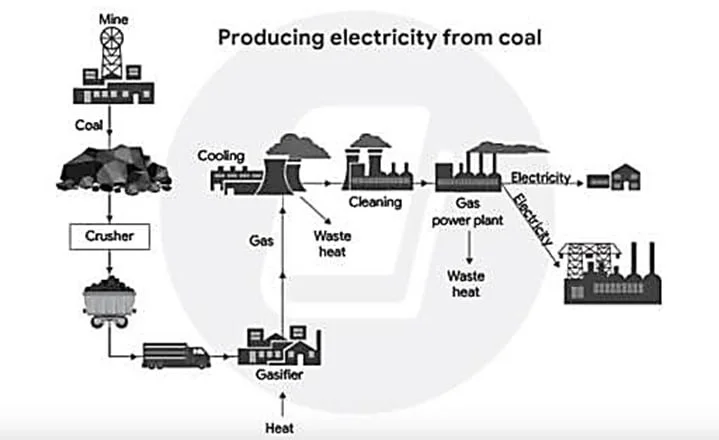
The diagram shows how one type of coal is used to produce electricity.
The diagram shows the linear process through which one type of coal is transformed into electricity. Overall, the system combines natural resources with engineering-based operations, moving coal throu…
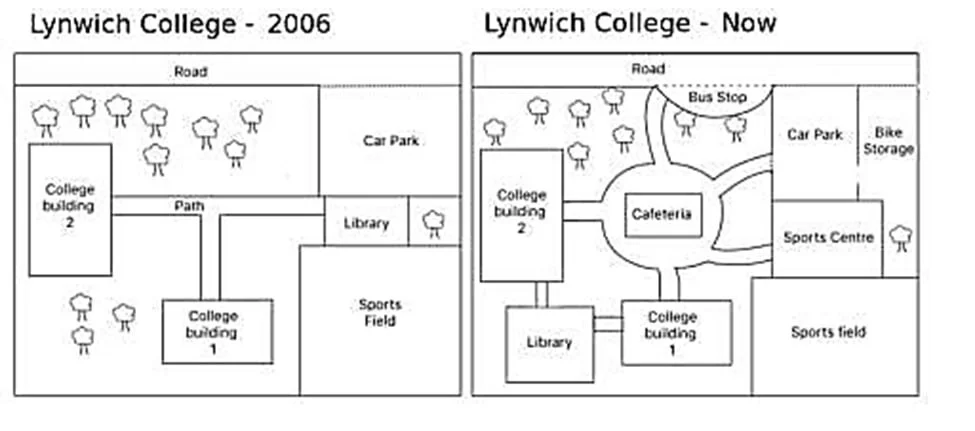
The plans show the site of a college in 2006 and the present day.
The two plans compare the configuration of a college in 2006 with its current state. The data suggest that the college has evolved from a simple layout offering limited amenities to a multifunctional…
