
بلاگ
مقالات و اخبار
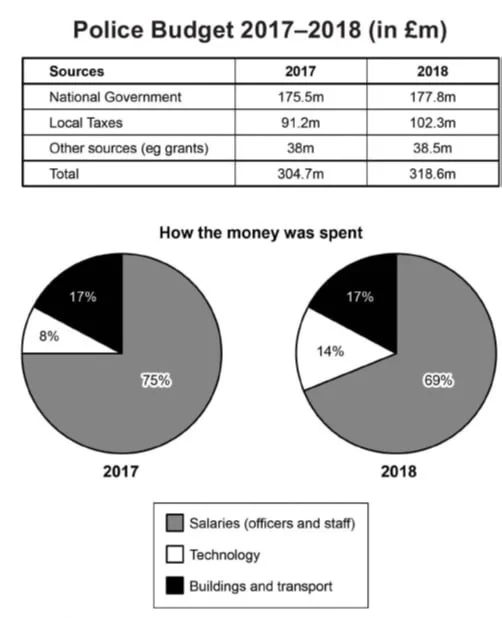
The table and chart give information on the police budget for 2017 and 2018 in one area of Britain. The table shows where the money came from, and the charts show how it was distributed.
The table and pie charts show the three sources of police funding (in millions of pounds) and their distribution in a region in Britain in 2017 and 2018. The data suggests that all three budget source…
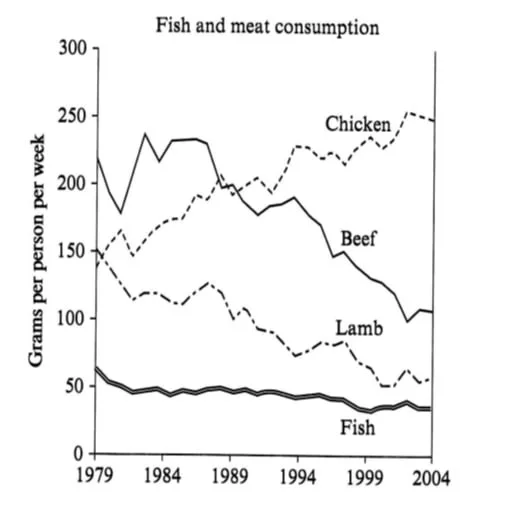
The graph shows the consumption of fish and some different kinds of meat in a European country between 1979 and 2004.
The line graph shows the quantity of four types of meat fish, lamb, beef, and chicken (measured in grams per person per week) in a country in Europe from 1979 to 2004. The data suggest that while the…
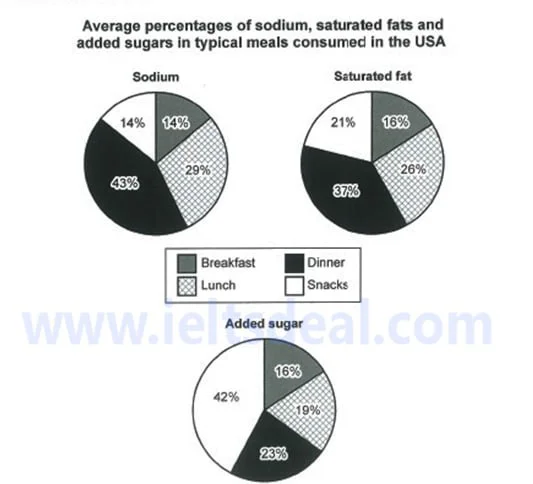
The charts show the average percentage in typical meals of three types of nutrients, all of which may be unhealthy if eaten too much.
The pie charts show the proportions of three potentially unhealthy substances, sodium, saturated fat, and added sugar, in four everyday meals in the US. Overall, lunch and breakfast show a balanced di…
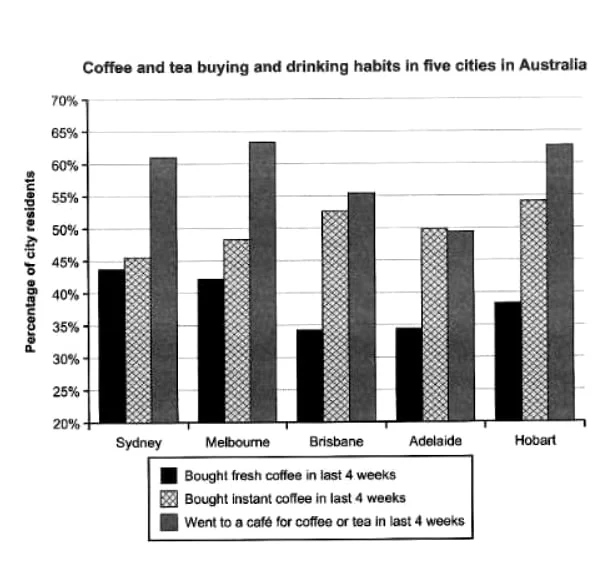
The chart shows the results of a survey about people’s coffee and tea buying and drinking habits in five Australian cities.
The bar chart shows people s tendencies to buy or drink coffee or tea in five cities in Australia in the last four weeks. Overall, the percentages of cafe visitors stand well above other tendencies in…
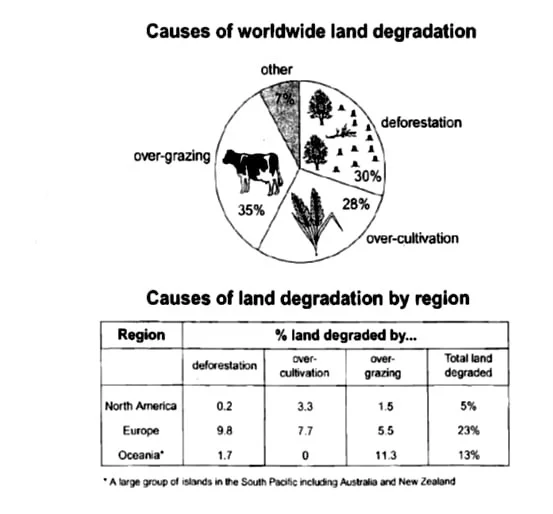
The pie chart below shows the main reasons why agricultural land becomes less productive. The table shows how these causes affected three regions of the world during the 1990s.
The pie chart shows three reasons along with a category of unlisted causes for the decline in the quality of agricultural land, and the table gives information on three regions suffering from the caus…
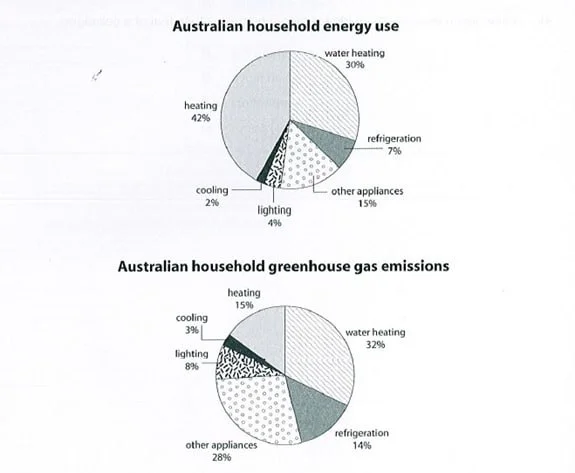
The first chart shows how energy is used in an average Australian household. The second chart shows the greenhouse gas emissions which result from this energy use.
The graphs show the proportions of five main energy uses, as well as a category of unspecified appliances, and their resultant CO2 emissions in an average Australian household. The data suggests that…
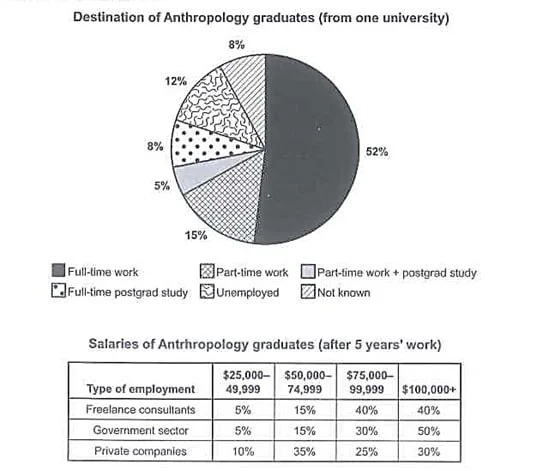
The chart shows what anthropology graduates from one university did after finishing their undergraduate degree course. The table shows the salaries of the anthropologists in work after five years.
The pie chart shows the six destinations of anthropology undergraduates, and the table shows their salary range in three types of employment after five years of employment. Overall, a markedly higher…
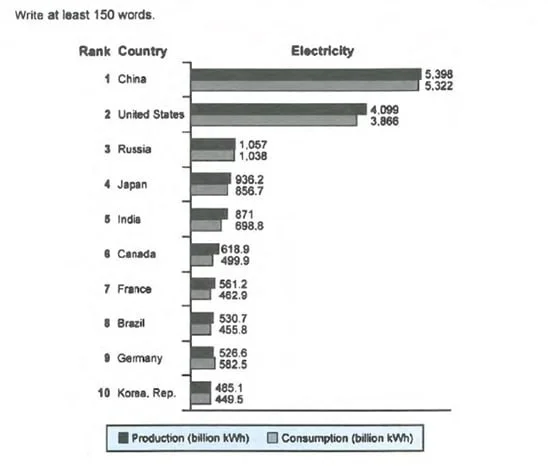
The chart shows the top ten countries for the production and consumption of electricity in 2014.
The chart shows the ten most dominant countries in producing and consuming electricity (in billion kWh) in the year 2014. Overall, two of the listed countries show unrivaled records, followed by three…
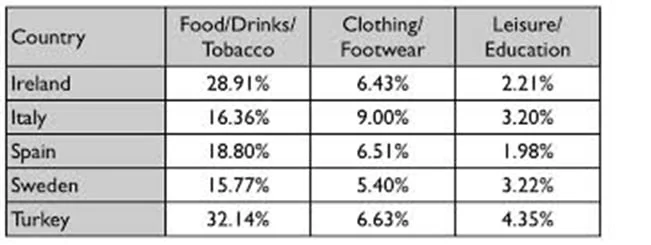
The table gives information on consumer spending on different items in five different countries in 2002.
The table shows the proportions related to consumer expenditure on three sets of items in five countries in the year 2002. Overall, of the three categories, consumer products boast the most marked per…
